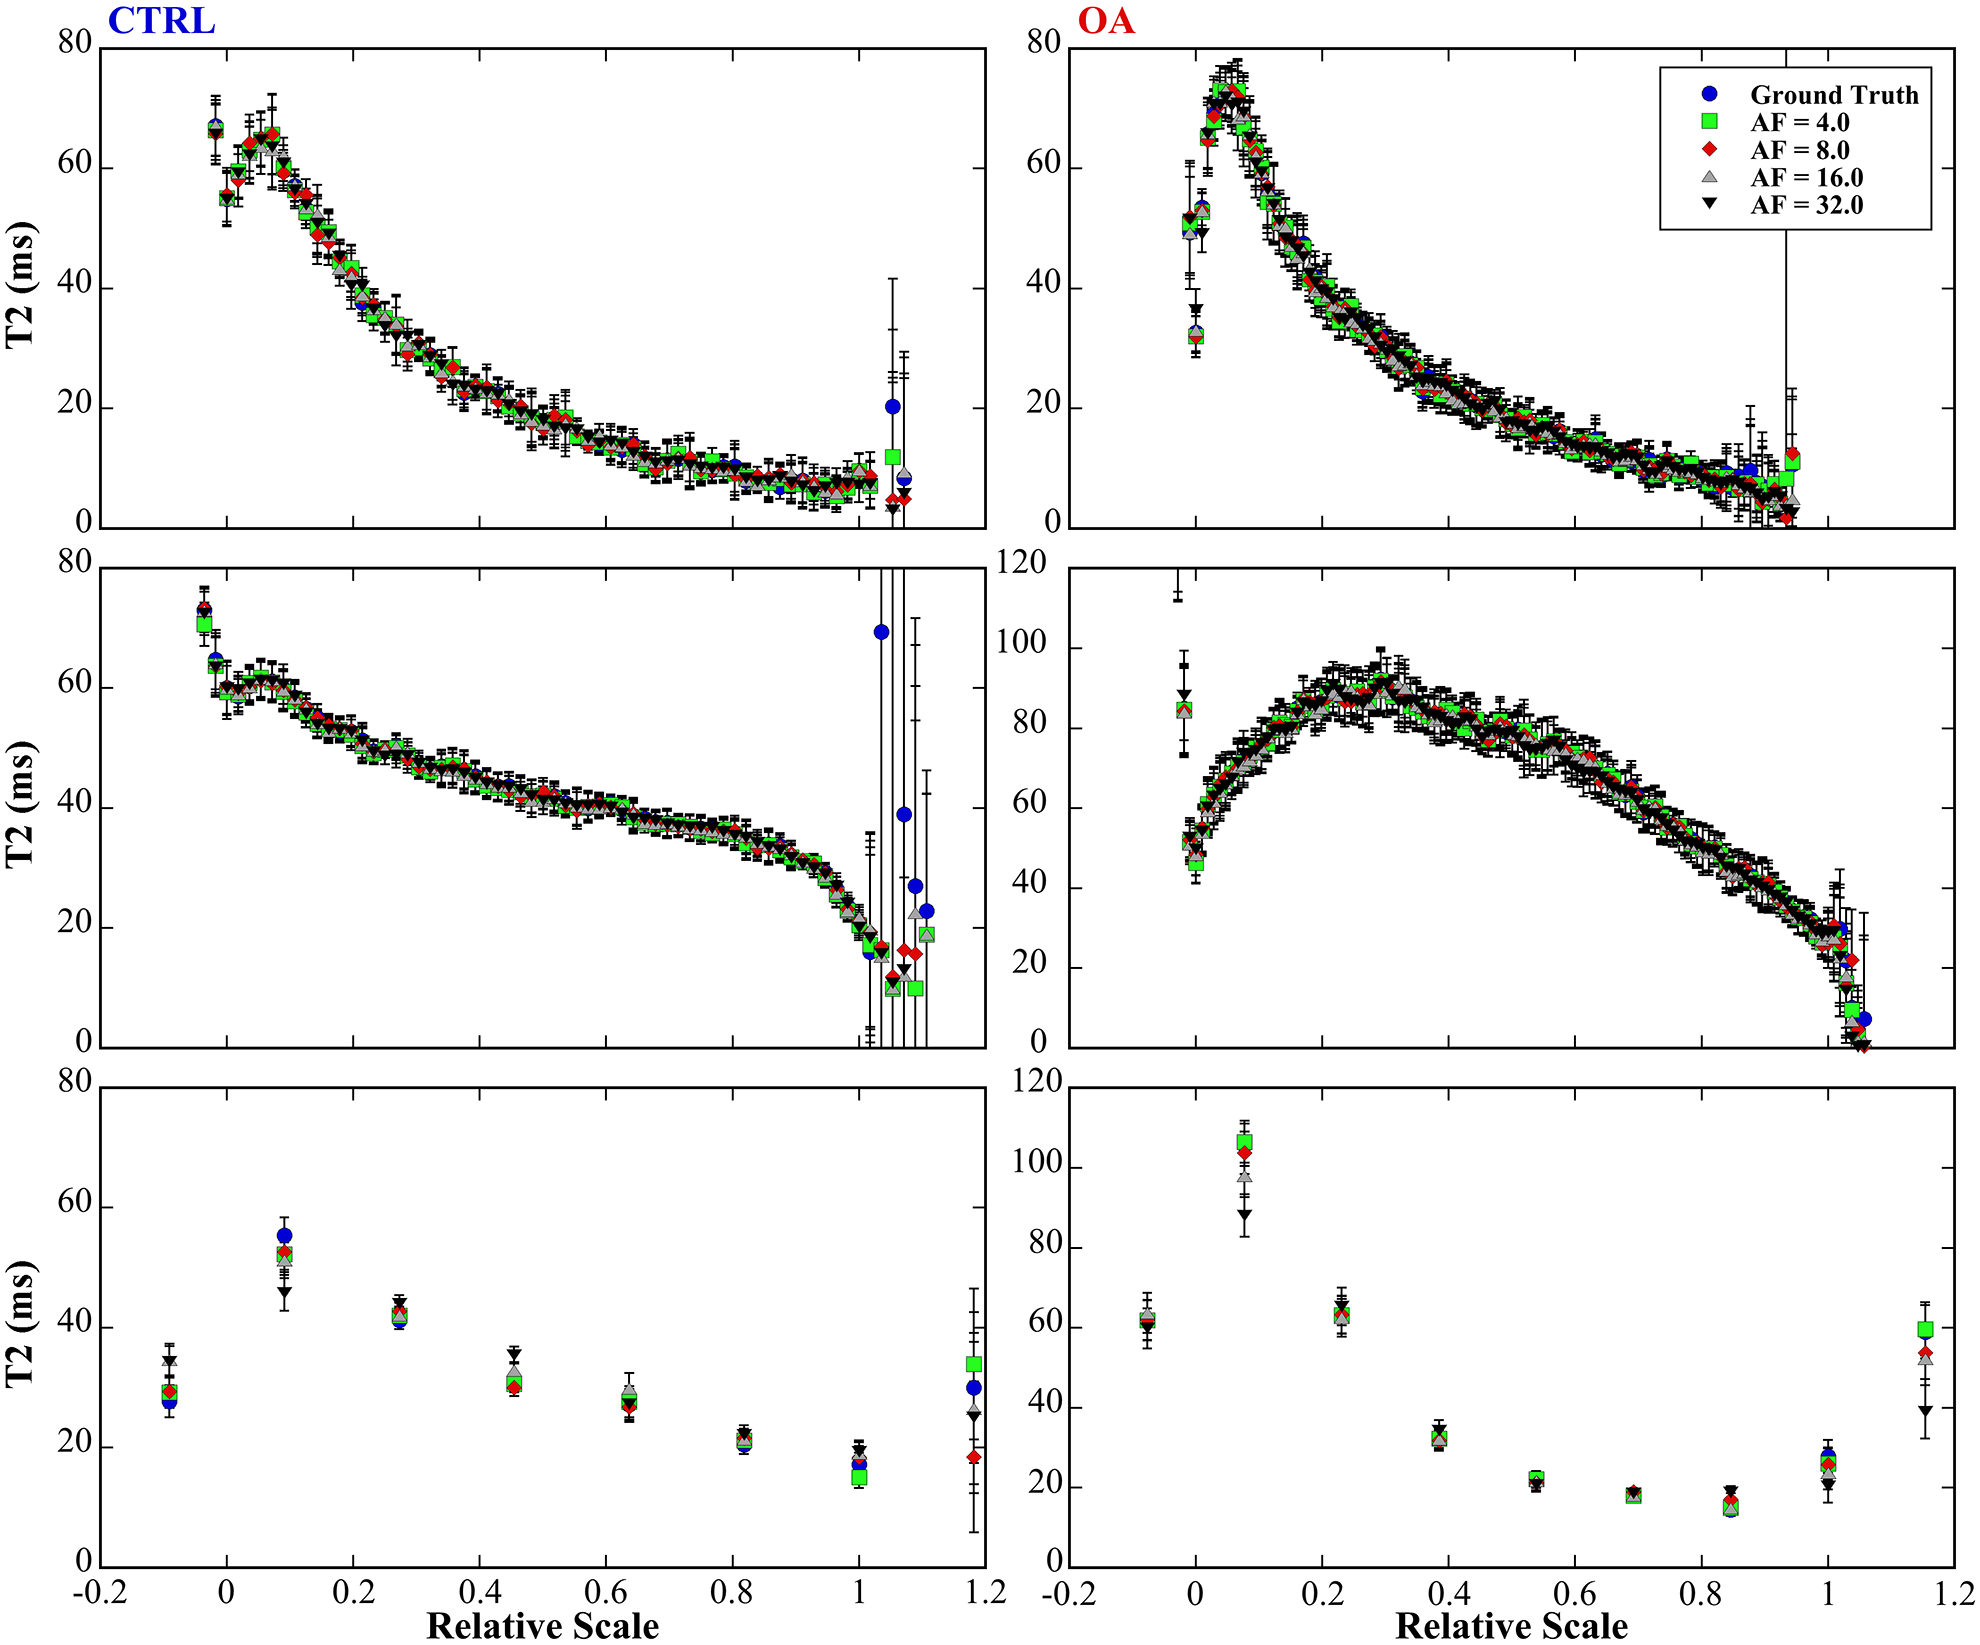
Figure 5.

The quantitative depth-dependent T2 profiles of CTRL and OA cartilages at both microscopic (a-b at 0°, c-d at 55°) and macroscopic resolution (e-f). The tissue had clear laminar appearance in the T2 profiles at 0° for both CTRL (a) and OA (b), and for both μMRI (e) and mMRI (f). The μMRI T2 profiles derived from different CS acceleration factors were consistent with the fully sampled data even at AF of 32. The mMRI T2 profiles (e-f) at different CS acceleration factors had similar trends, while the deviations were visually larger at SZ and RZ.
