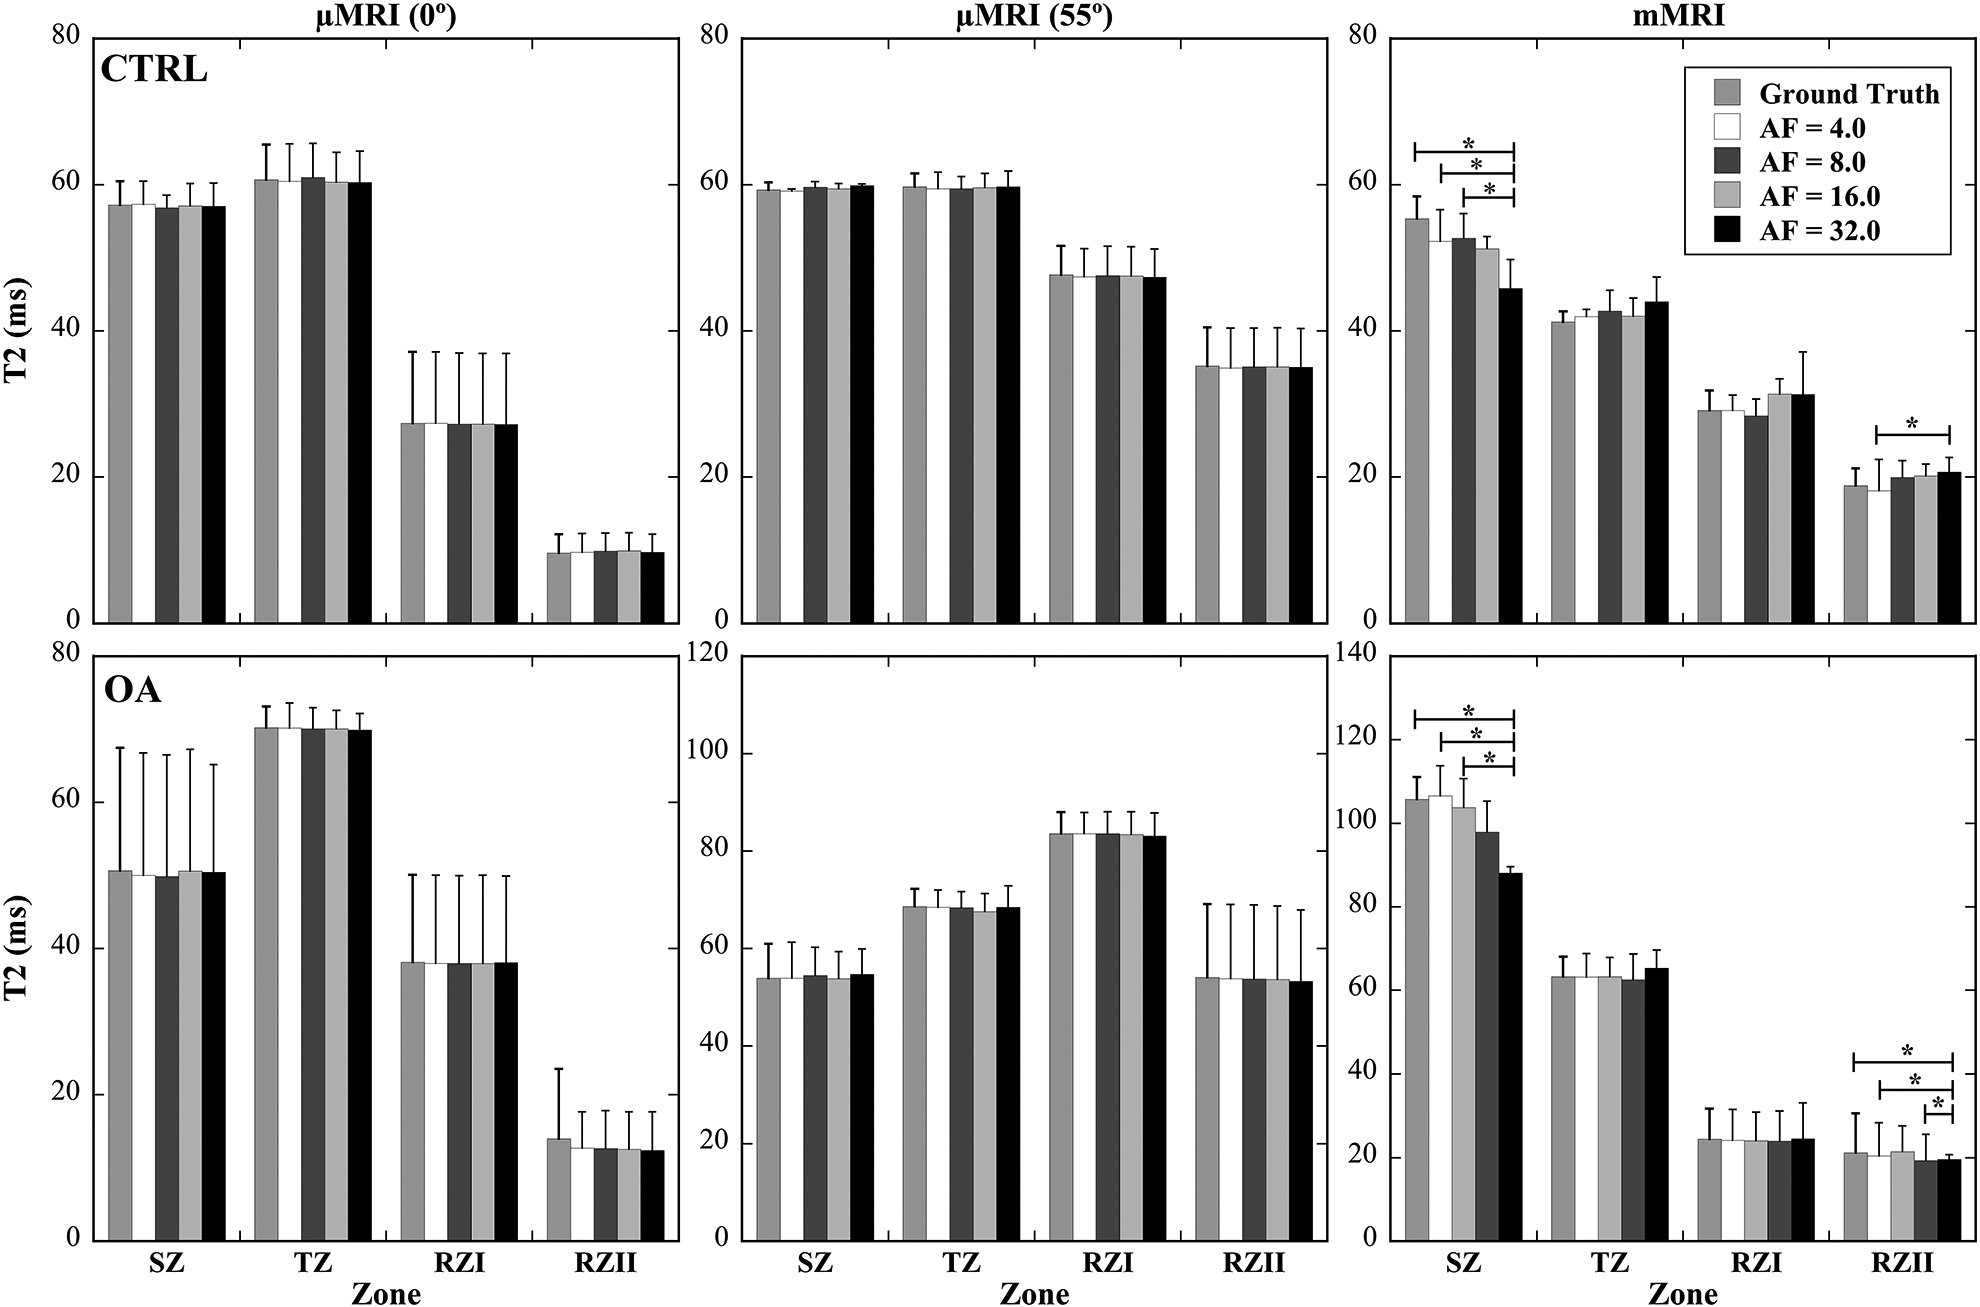
Figure 6.

The zonal changes of T2 in articular cartilage at various AFs (4, 8, 16, 32) for both μMRI (0° and 55°) and mMRI. The whole cartilage thickness was divided to 4 sub-tissue structural zones for both mMRI and μMRI: SZ, TZ, and upper RZ (RZI) and lower RZ (RZII) in order to investigate the T2 variations in these zones at different AFs for both CTRL and OA. The asterisks indicate the statistical significance from the pair-wise comparisons using a Tukey HSD test with p<0.05 as significant.
