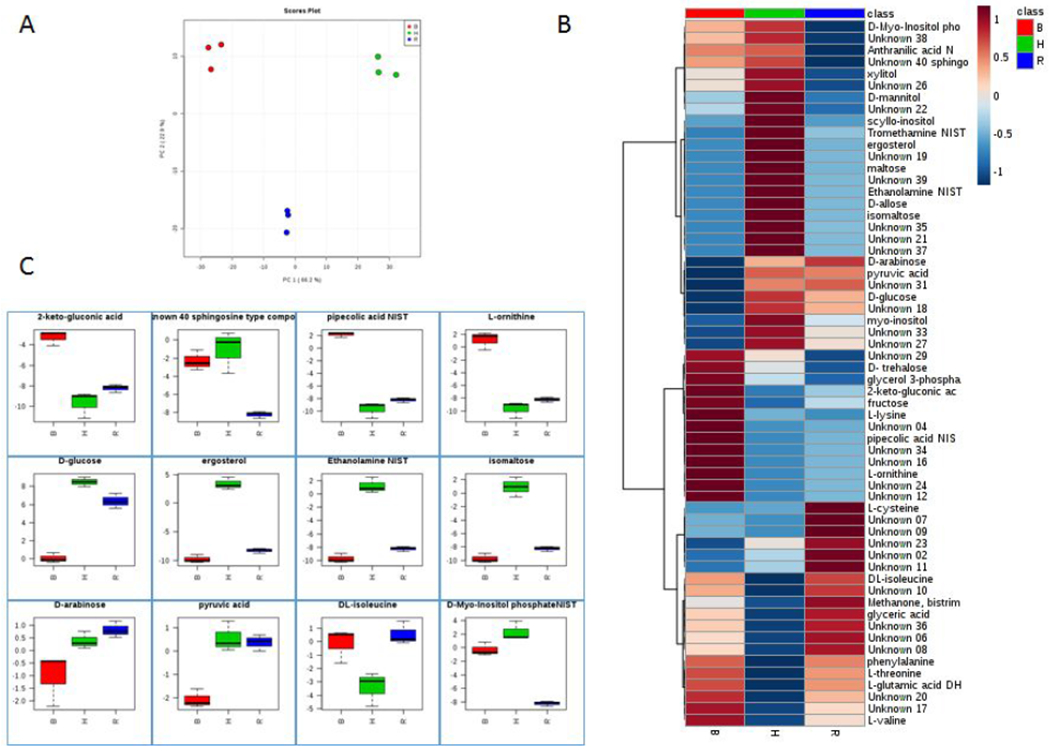
Figure 6. Metabolic pathways affected by different media.

The PCA plot (A) illustrates the distinction between the metabolic profiles of EVs from different media. In the heatmap (B) the metabolites detected in EVs from H. capsulatum cultivated in different media. Some of the detected metabolites were depicted (C) to show their variation among EVs from different growth conditions.
