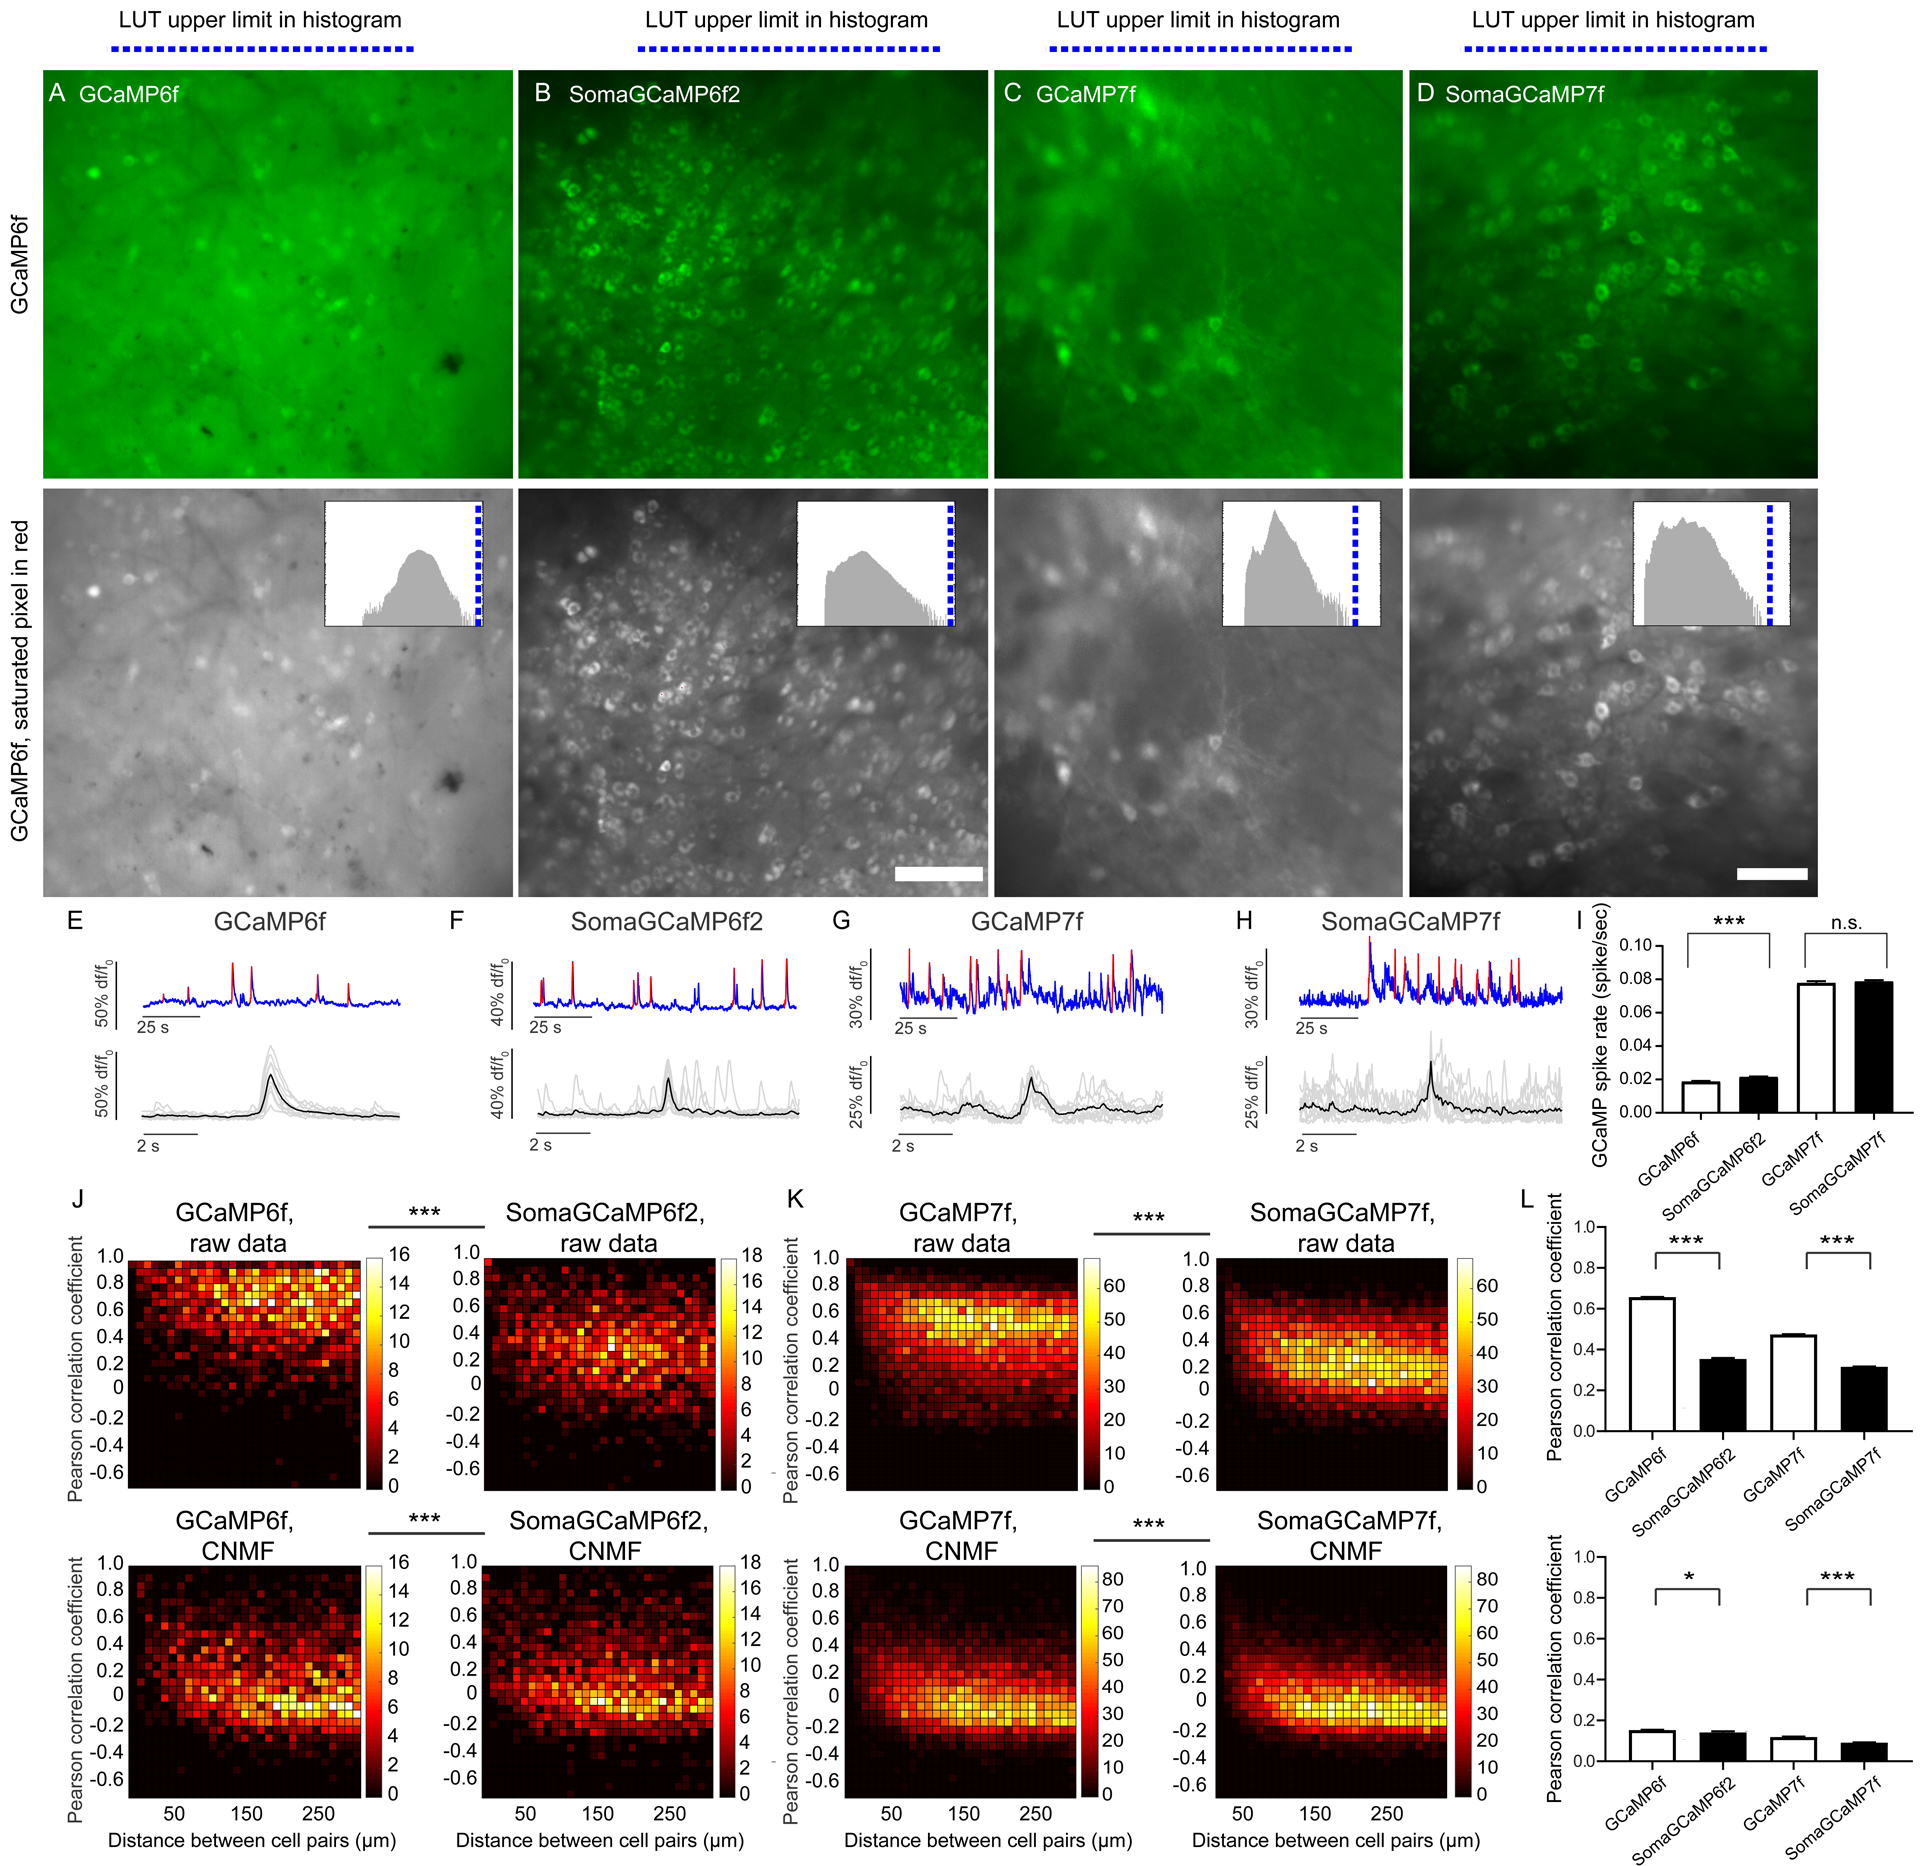
Figure 7. SomaGCaMP reduces neuropil contamination in the striatum of behaving mice.

(A, B, C, D, top row) Representative projection images showing the fluorescence summed across the frames of an epifluorescent imaging session, from the dorsal striatum in GCaMP vs. SomaGCaMP mice. Scale bar: 100 μm. (A, B, C, D, bottom row) The images in A, B, C, D presented in grayscale, with saturated pixels in red (note: none are red). Histograms of pixel values in upper right corners; blue line, upper limit of LUT. Supplemental Table 8, percentages of saturated pixels in GCaMP images. (E-H) Top, representative calcium traces from the experiments of A-D. Blue, calcium traces; red, calcium events identified based on thresholding. Bottom, calcium events from the top traces, aligned, with individual events in gray and averages in black. (I) Bar chart of GCaMP-spike rates (n = 930 neurons from 6 GCaMP6f mice, n = 594 neurons from 4 mice expressing SomaGCaMP6f2, n = 634 neurons from 4 GCaMP7f mice, n = 1098 neurons from 5 mice expressing SomaGCaMP7f). ***P <0.001, Kruskal-Wallis analysis of variance followed by post-hoc test via Dunn’s test; Supplemental Table 3, statistics for Figure 7. Shown throughout this figure is mean plus or minus standard error. (J) Correlated fluorescence vs. distance for cell pairs from mice expressing GCaMP6f (left; n = 860 cells from 6 mice) or SomaGCaMP6f2 (right; n = 149 cells from 4 mice), without (top) and with (bottom) CNMF. ***P < 0.001, two-dimensional Kolmogorov-Smirnov test. (K) As in J but for GCaMP7f (left; n = 634 cells from 4 mice) and SomaGCaMP7f (right; n = 1098 cells from 5 mice). (L) Bar plot showing Pearson correlation coefficients (n = 67795 cell-pairs from 6 GCaMP6f mice, n = 44890 cell-pairs from 4 SomaGCaMP6f2 mice, n = 12582 cell-pairs from 4 GCaMP7f mice, n = 10420 cell-pairs from 5 SomaGCaMP7f mice), without (top) and with (bottom) CNMF. *P < 0.05, ***P < 0.001, Kruskal-Wallis analysis of variance followed by post-hoc test via Dunn’s test.
