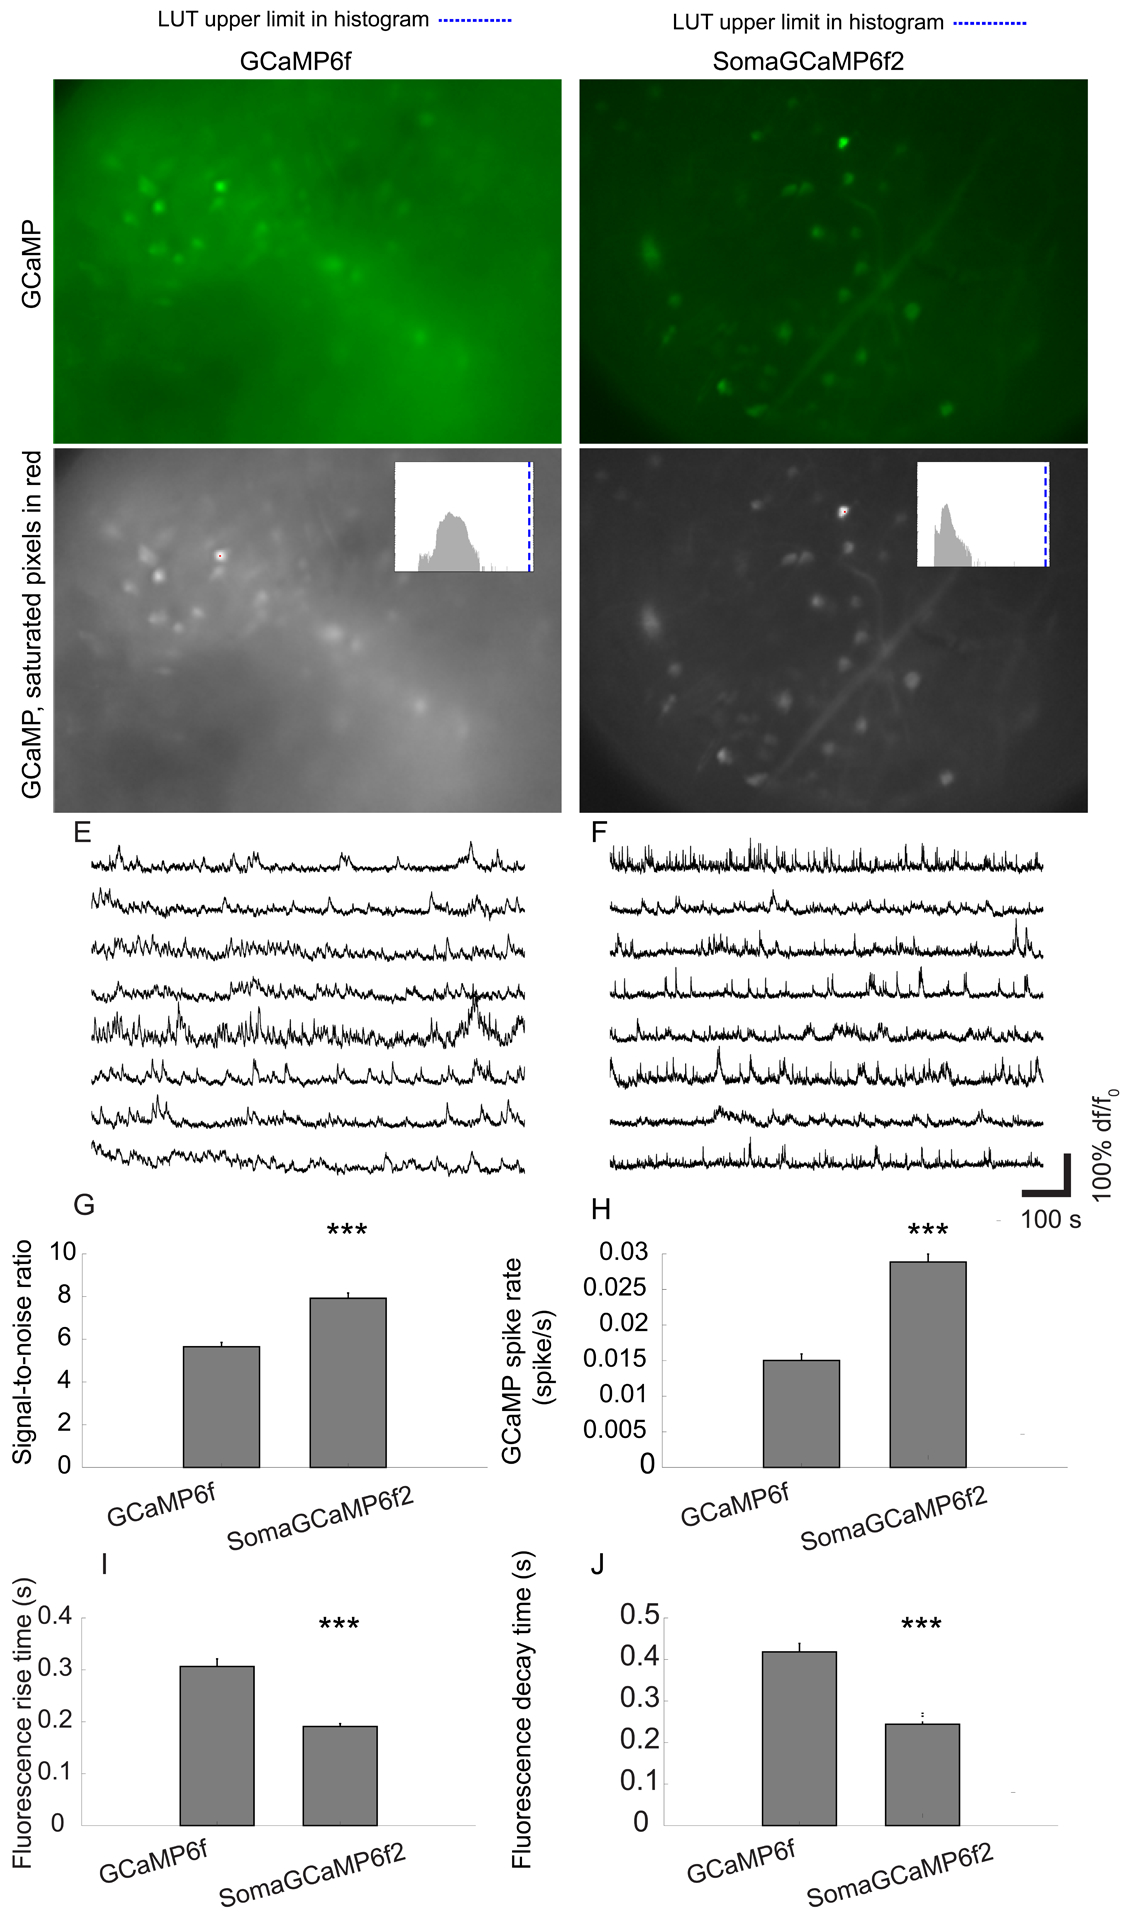
Figure 8. SomaGCaMP imaging improvements in medial prefrontal cortex of awake mice imaged with endoscopic microscopes.

(A, B) Representative standard deviation images showing fluorescence fluctuation across the frames of an epifluorescent imaging session, from the medial prefrontal in GCaMP6f- (A) or SomaGCaMP6f2- (B) expressing mice. (C, D) The images in A, B presented in grayscale, with saturated pixels in red (one pixel in each image). Histogram of pixel values, in upper right corner. Blue line, upper value of histogram LUT. Supplemental Table 8, percentages of saturated pixels. (E, F) Representative calcium traces from neurons in the experiments of A-D. (G) Bar chart of SNR (n = 222 neurons from 4 mice expressing SomaGCaMP6f2, n = 107 neurons from 2 GCaMP6f mice). ***P <0.001, Wilcoxon rank sum test; Supplemental Table 3, statistics for Figure 8. Plotted is mean plus or minus standard error throughout. (H) As in G, but for GCaMP spike rates. (I) As in G, but for fluorescence rise times. (J) As in G but for fluorescence decay times.
