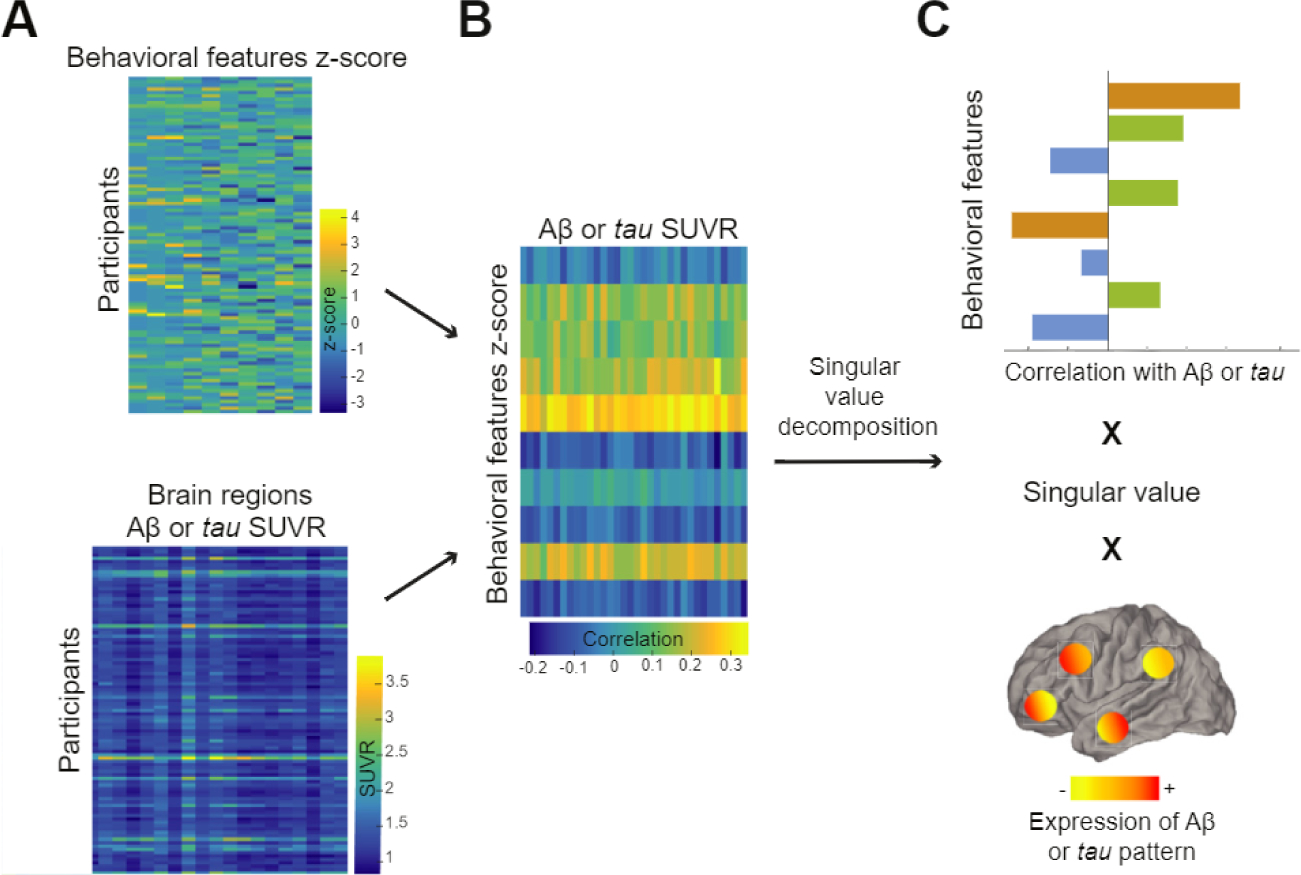
Figure 1.

Partial least squares analysis finds maximally correlated linear combinations of two input matrices, one with behavioral features (top matrix in A) and the other with Alzheimer’s disease pathology across defined cortical regions (bottom matrix in A). These two matrices are then correlated together, and this latter matrix (B) is decomposed into multiple latent variables using singular value decomposition. (C) An example of a latent variable. Briefly, each latent variable consists of a singular value (related to the covariance between the 2 input matrices) and 2 vectors of weights representing how much each behavioral feature and each brain region contribute the overall multivariate relationship. Aβ. amyloid-β; SUVR, standardized uptake value ratio.
