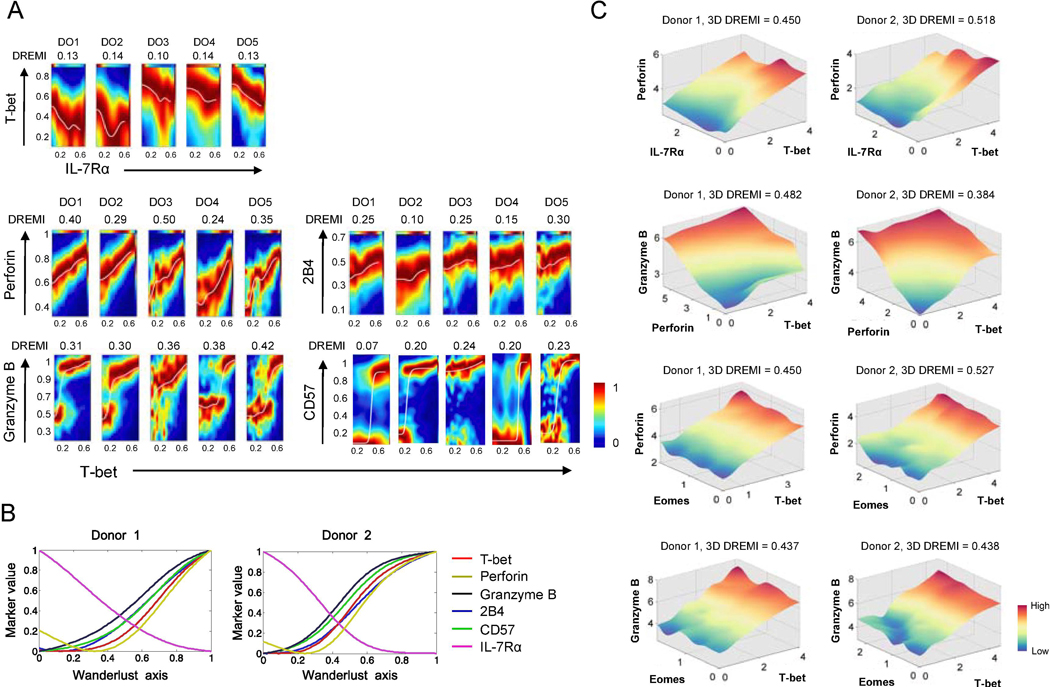
Fig. 4. The signature of the transcription factor T-bet is present at different levels across human effector memory CD8+ T cells as determined by the expression of T-bet and its target molecules at the single cell level.
PBMCs of healthy human subjects were stained with antibodies to a set of molecules, including IL-7RA, T-bet, eomesodermin (Eomes), perforin, granzyme B, CD57, and 2B4, and run on a Helios CyTOF instrument. (A) 2-dimensional DREVI plots showing the expression relationship of IL-7Rα with T-bet as well as of T-bet with perforin, granzyme B, CD57, and 2B4 in EM CD8+ T cells of 5 donors (DO1-DO5). DREMI scores that indicate the strength of the statistical dependency between two molecules are shown above the DREVI plots. (B) Expression trajectories of T-bet, perforin, granzyme B, 2B4, CD57 and IL-7Rα in EM CD8+ T cells as determined by the trajectory detection algorithm Wanderlust. EM CD8+ T cells that expressed high levels of IL-7Rα and CD27 and low levels of CD57 were used as the youngest cells or the starting point of trajectories, in the Wanderlust analysis. (C) 3-dimensional (3D) DREVI plots showing the expression relationship of T-bet with perforin, granzyme B, IL-7Rα and Eomes CD8+ T cells. DREMI scores that indicate the strength of the statistical dependency in three molecules are shown above the DREVI plots. Representative data from 5 donors.

