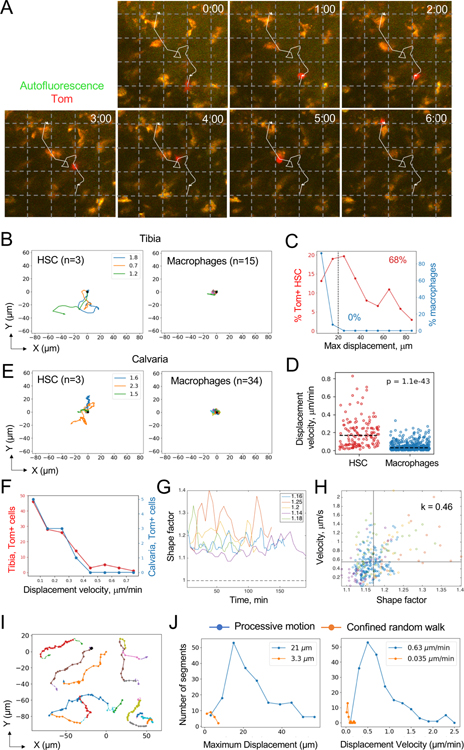
Fig. 2. Analysis of HSC behavior in the steady-state BM by TPLSM.
(A) TPLSM snapshots at the indicated times (hours:minutes) demonstrating a representative Tom+ HSC (red) among autofluorescent macrophages (orange). The trajectory of the HSC during the observation period is indicated. Grid, 25 μm.
(B) Two-dimensional (XY) tracks of individual Tom+ HSCs imaged in the tibia of a representative animal. Times of HSC tracking in hours are indicated by the colored legends; right panel shows tracks of autofluorescent macrophages from the same animal.
(C) The distribution of maximum displacements of Tom+ HSCs (red) or autofluorescent macrophages (blue). Fractions of cells above the threshold 20 μm displacement (dashed line) are indicated.
(D) Displacement velocities of individual Tom+ HSCs (n = 139) and macrophages (n = 582). Dashed lines indicate medians.
(E) Two-dimensional (XY) tracks of individual Tom+ HSCs imaged in the calvaria of a representative animal. Data are presented as in panel B.
(F) The distribution of displacement velocities of Tom+ HSCs in the tibia (red) or calvaria (blue).
(G) Change in shape factor over time in representative HSCs from five individual animals; average values for each cell are indicated.
(H) Correlation between shape factor and cell velocity for cells from panel G; each symbol represents a separate time point.
(I) Representative examples of processive motion (PM) segments (solid colored lines) for six different HSCs from five individual animals.
(J) Distribution of movement parameters for PM (blue) and CRW segments (orange) across all Tom+ HSCs; numbers on each plot represent median values for the respective parameters.

