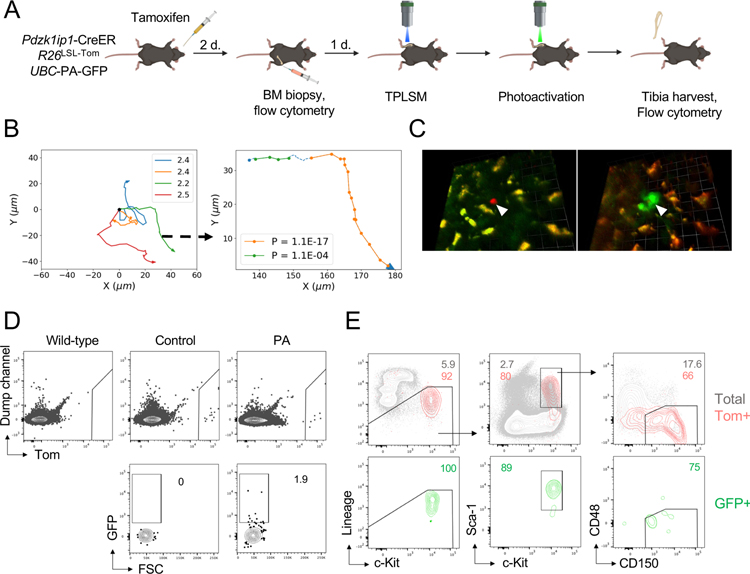
Fig. 3. The phenotype of motile HSCs as determined by photoactivation.
(A) Schematic illustrating the experimental design of photoactivation, including tamoxifen administration, BM biopsy, and intravital TPLSM before and after photoactivation. Only Tom+ that were motile were selected for photoactivation.
(B) XY tracks of individual HSCs before photoactivation (left) and a representative example of track segmentation of a single HSC (right). Numbers on the plot on the right represent P(Rnm) values for each PM segment.
(C) Representative fluorescent micrograph image from a photoactivation experiment. Shown is a compressed z-stack image of a Tom+ HSC (white arrowhead) immediately before (left) and following photoactivation (right). Autofluorescent macrophages are distinguished in orange. Scale bars 12.7 μm (left) and 14.2 μm (right).
(D-E) The detection and analysis of Tom and GFP signals cells in Pdzk1ip1-CreER R26LSL-Tom UBC-PA-GFP animals either photoactivated tibia (PA) or contralateral tibia (Control). CreER-negative (Wild-type) animal used as negative control. Shown are representative FACS plots showing expression of Tom and GFP within the total BM cells (D) and the phenotypes of Tom+ and GFP+ cells (E). Data concatenated from two individual experiments from two separate animals.

