
Figure 3. CISH−/− iPSC-NK cells have better expansion and functions in vitro compared with WT iPSC-NK cells.
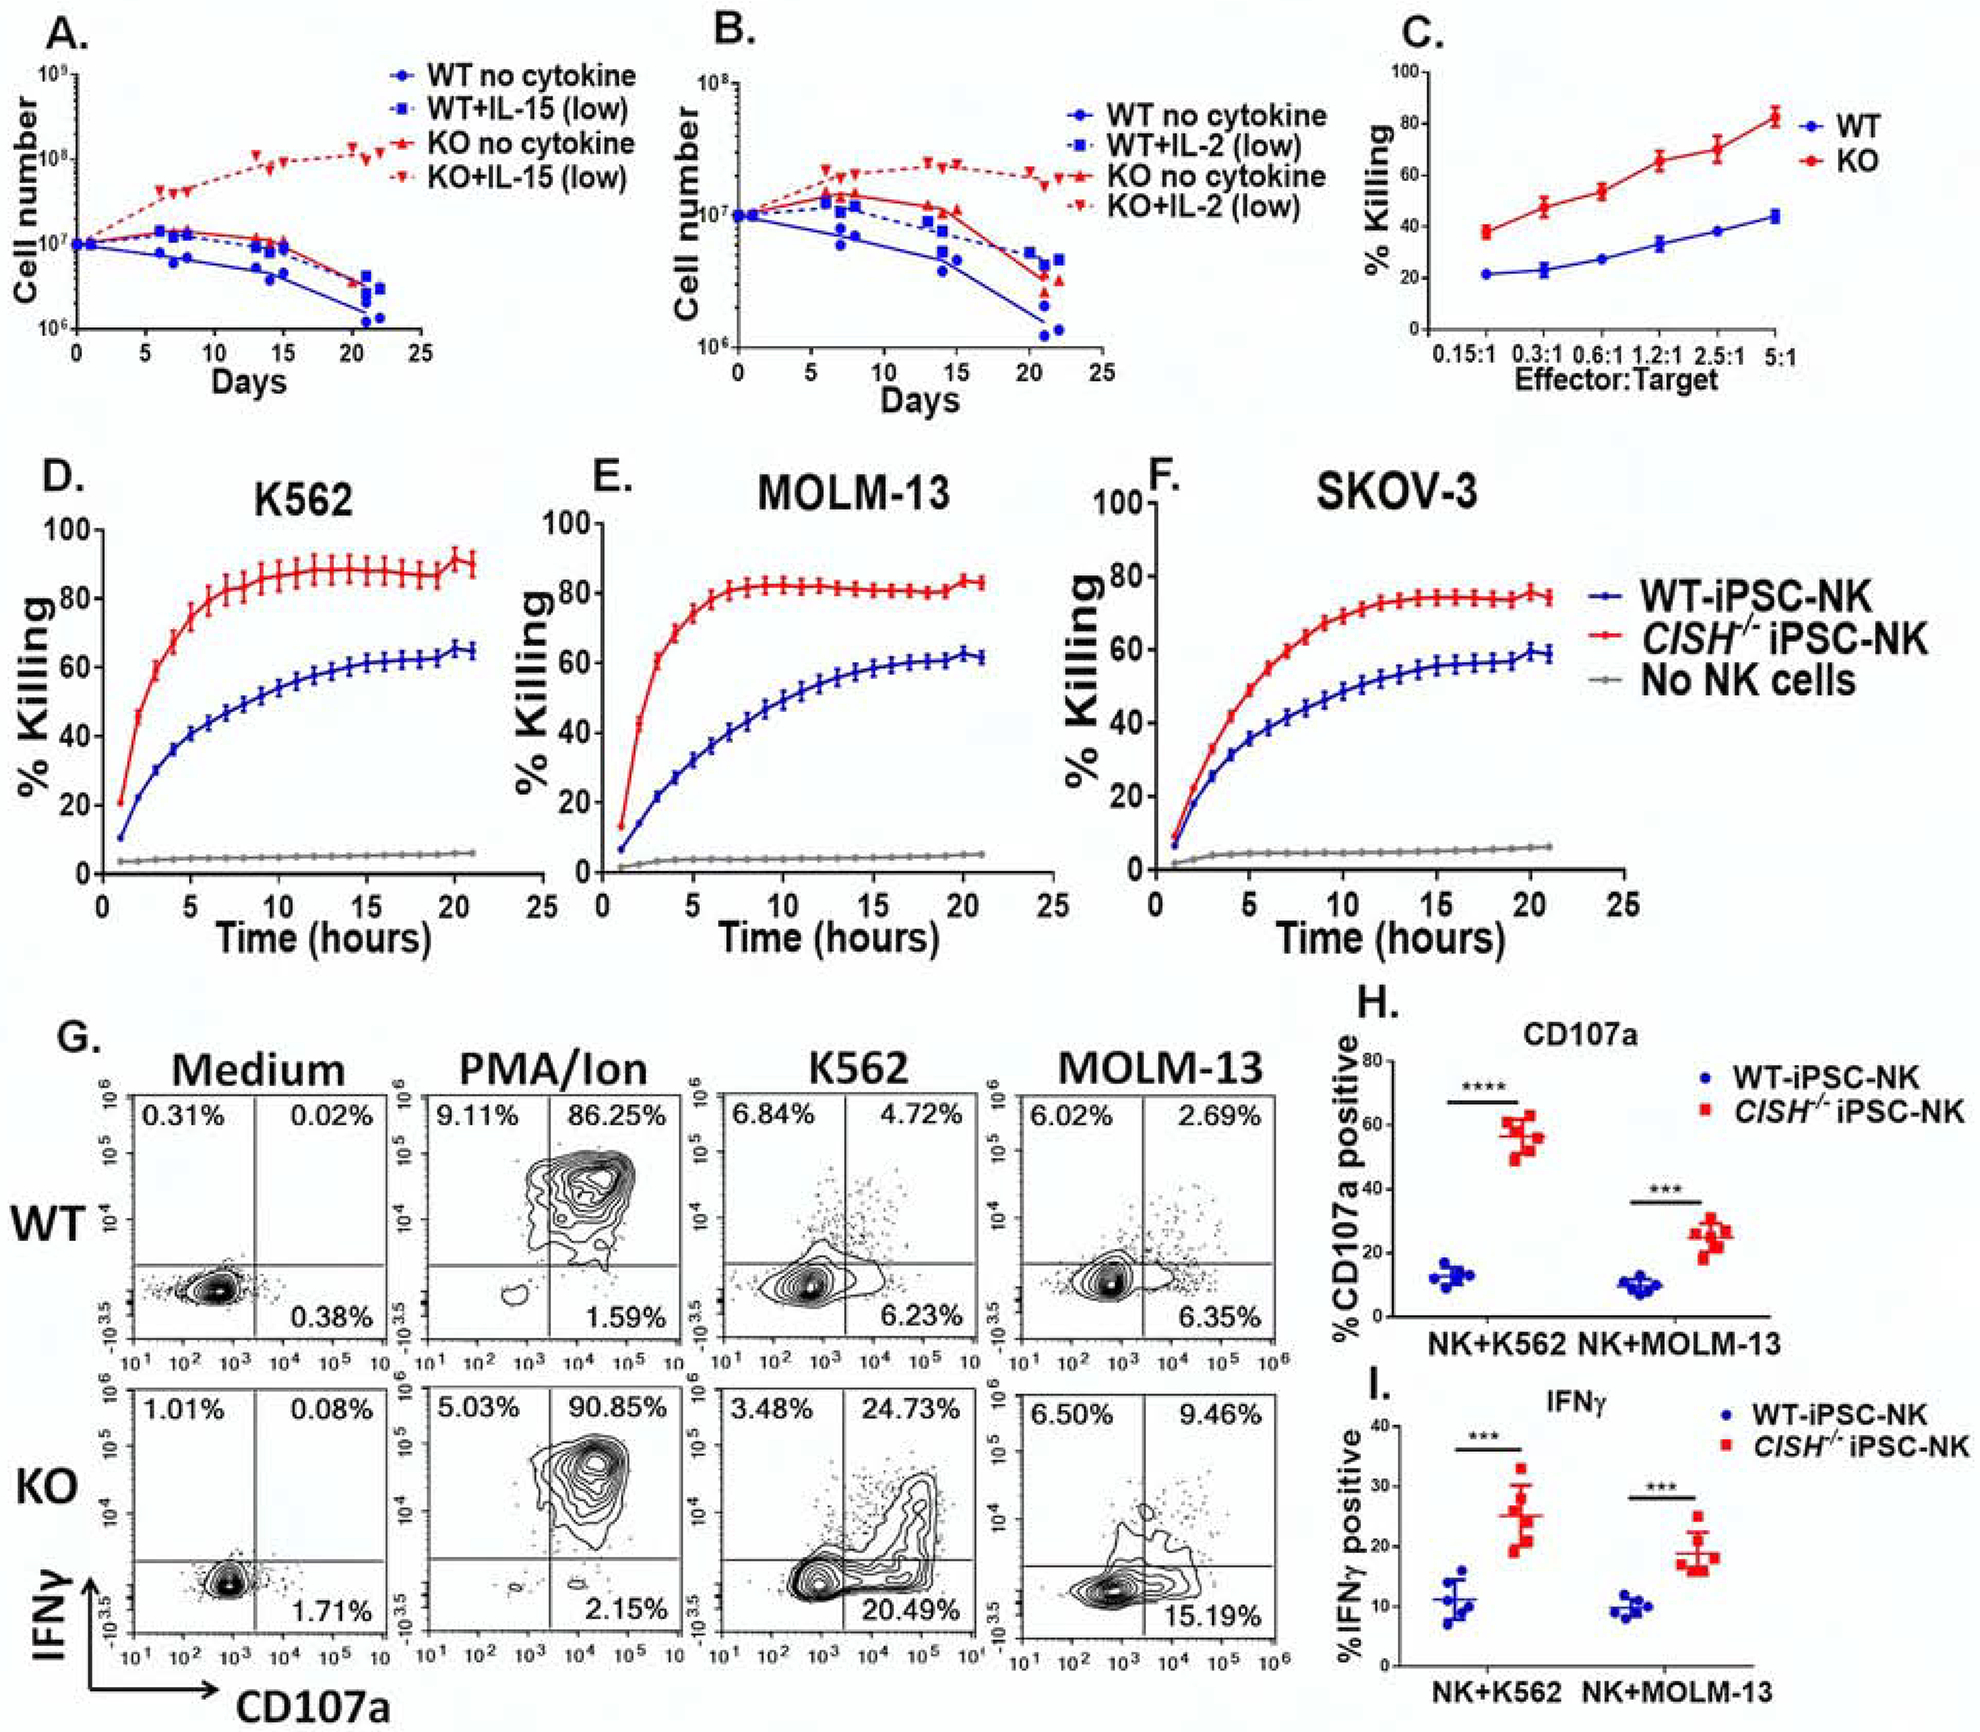
A&B Growth curve of CISH−/− iPSC-NK cells and WT iPSC-NK cells with or without a low concentration of IL-15 (A. 1ng/ml) and IL-2 (B. 10 U/ml). Data was repeated independently in 3 separate experiments. C. 4 hour cytotoxicity assay using CISH−/− iPSC-NK and WT iPSC-NK cells against K562 cells after 3 weeks of culture in low concentration IL-15 as determined using CellEvent™ Caspase-3/7 Green Flow Cytometry Assay. D–F. Killing against K562 (D), MOLM-13 (E) and SKOV-3 (F) cells was quantified over an extended time course using the IncuCyte real-time imaging system at E:T=1:1. G. CISH−/− iPSC-NK cells and WT iPSC-NK cells were maintained at low IL-15 for 3 weeks and production of CD107α and IFNγ in response to K562 and MOLM-13 cells was measured. CISH−/− iPSC-NK cells and WT iPSC-NK cells were left unstimulated or stimulated with a 1:1 ratio of target cells and stained for CD107a and IFNγ 4 hours later. Quantification of CD107a (H, n=6) and IFNγ (I, n=6) after stimulation with K562 or MOLM-13 cells. Paired t test was used to do the comparisons. ***P < 0.001, ****P < 0.0001. Data at C–F, H and I were shown as mean ± SD. Data at C-I were repeated in 3 separate experiments.