
Figure 4. CISH−/− iPSC-NK cells demonstrate improved persistence and better anti-tumor activity in vivo.
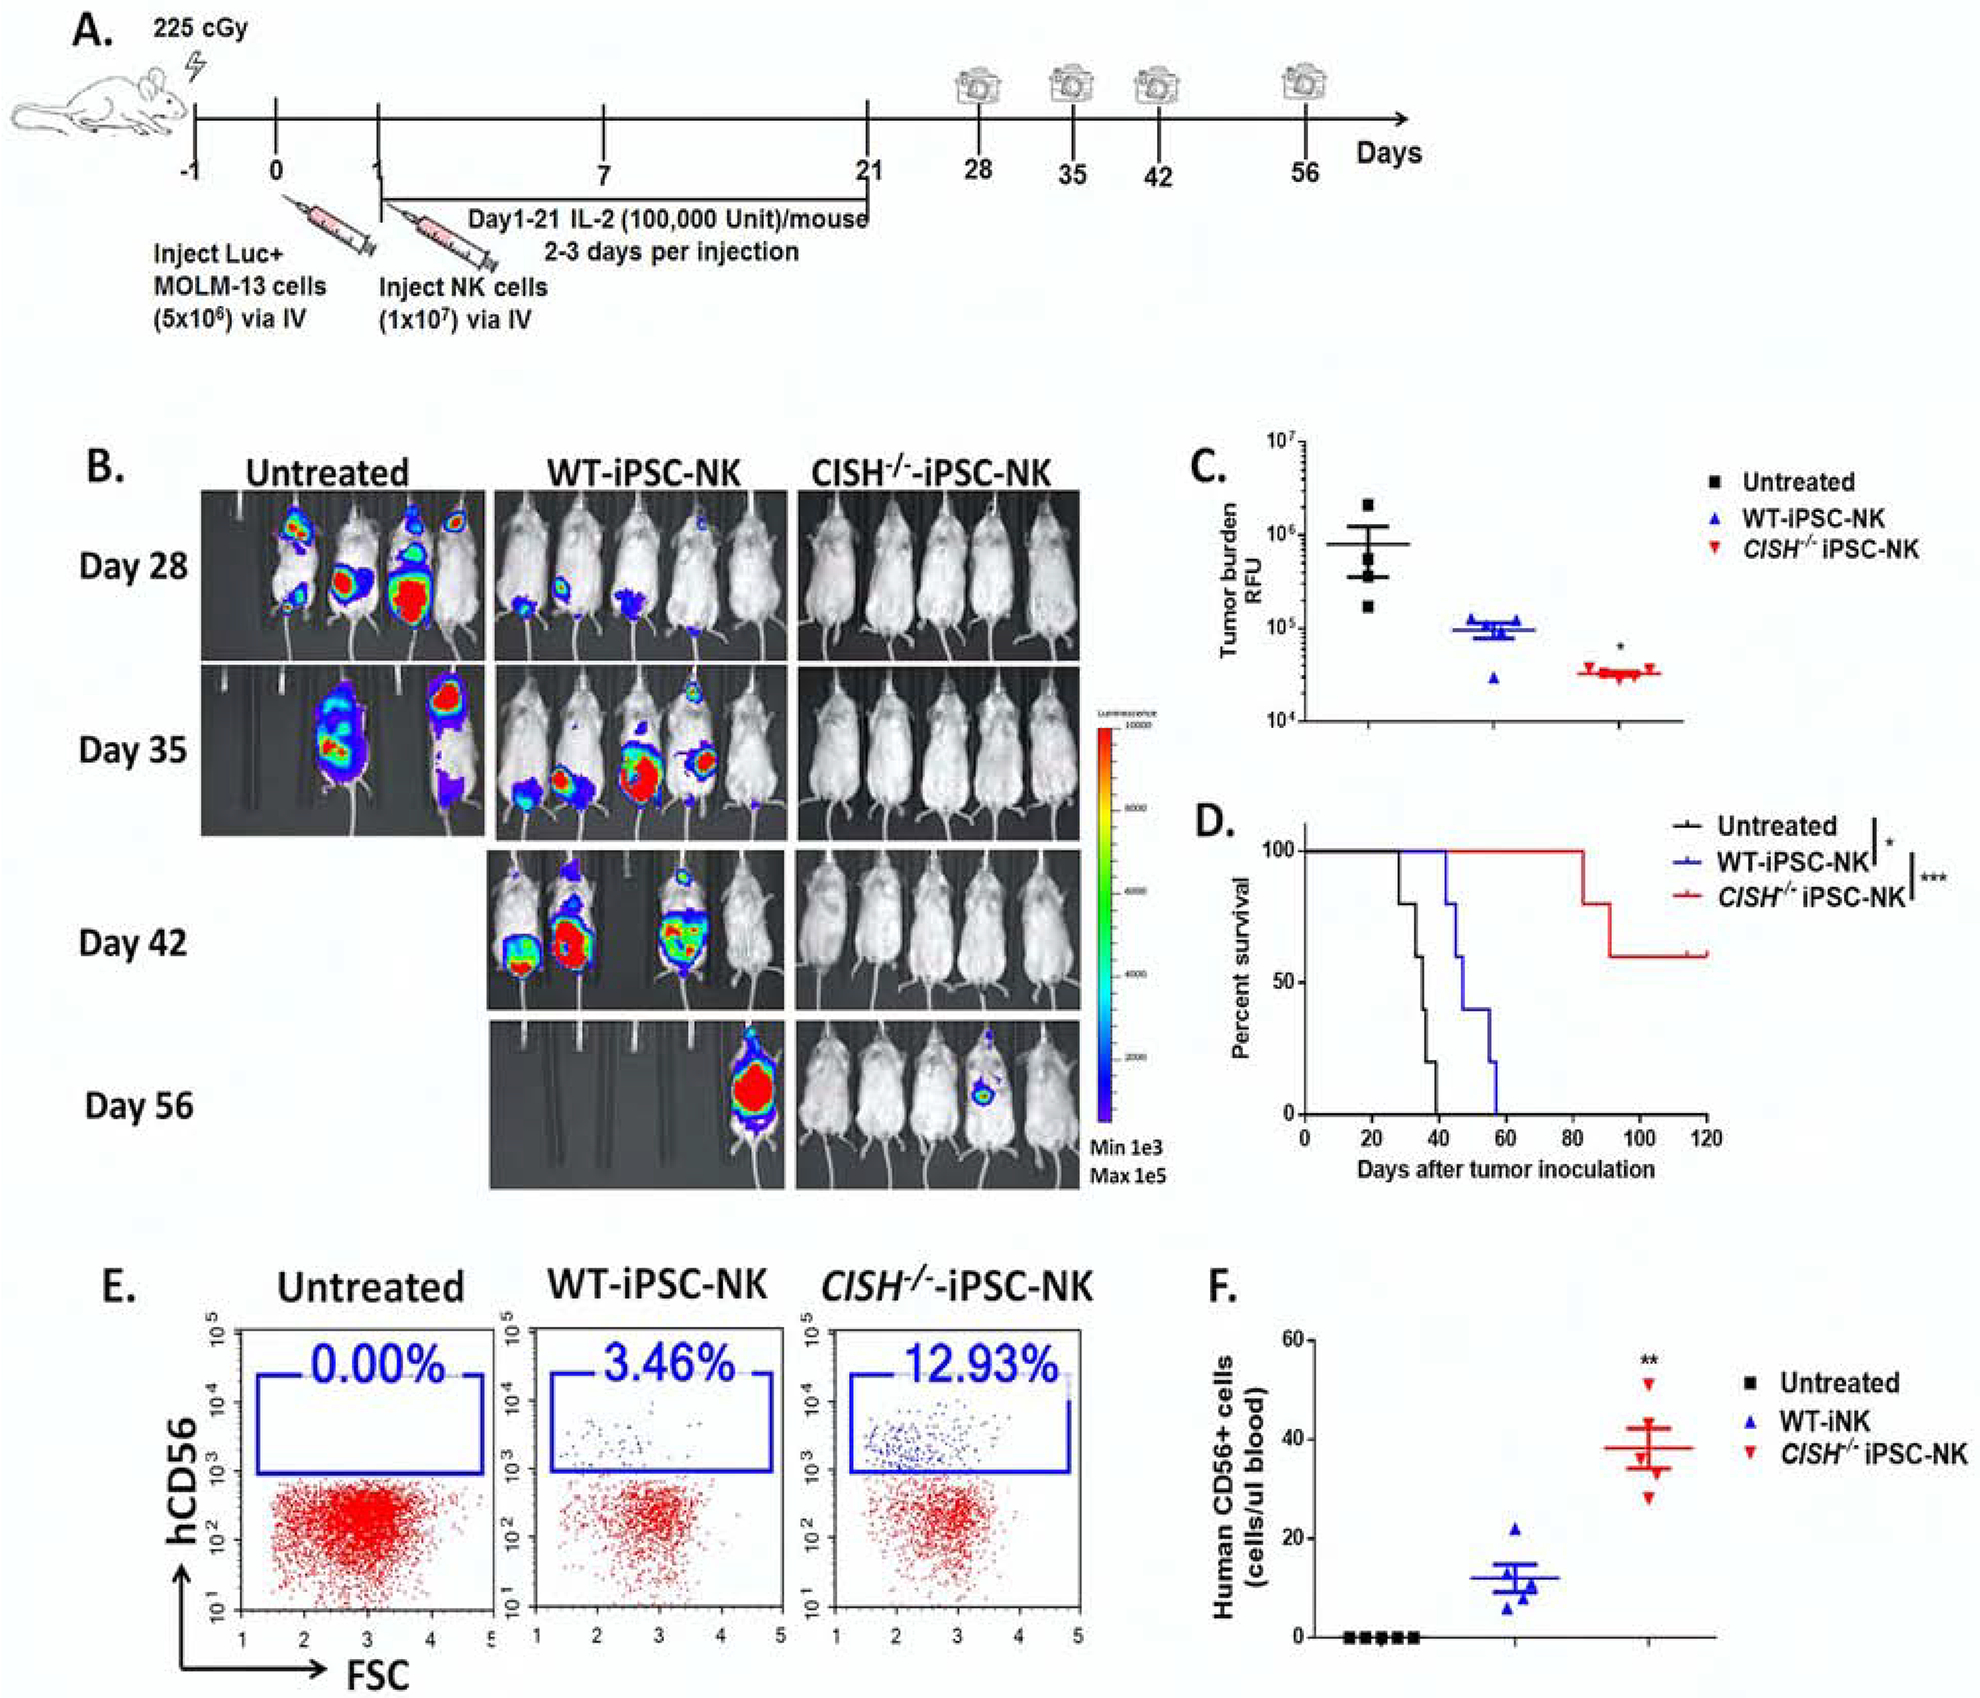
A. Diagram of in vivo treatment scheme. NSG mice were inoculated iv with 5×10⁶ MOLM-13 cells expressing the firefly luciferase gene. 1 day after tumor injection, mice were either left untreated or treated with 1×10⁷ WT-iPSC-NK or CISH−/− iPSC-NK cells. NK cells were supported by weekly injections of IL-2 for 3 weeks, and IVIS imaging was done to track tumor load. B. IVIS images showing progression of tumor burden. C. Tumor burden at day 28 was quantified and shown as mean ± SD. Statistics by one way ANOVA test; *p<0.05. D. Kaplan-Meier curve demonstrating survival of the experimental groups. Statistics: two-tailed Log-rank test, WT-iPSC-NK vs untreated, *p<0.05; WT-iPSC-NK vs CISH−/− iPSC-NK, ***p<0.001. E. Representative flow cytometric plot of human CD56+ cells in population from mice peripheral blood 7 days after NK cell treatment. F. Quantification of human CD56+ cells in peripheral blood (number of hCD56+ cells/ul blood) at Day 7, shown as mean ± SD. Statistics by one way ANOVA test; **p<0.01.