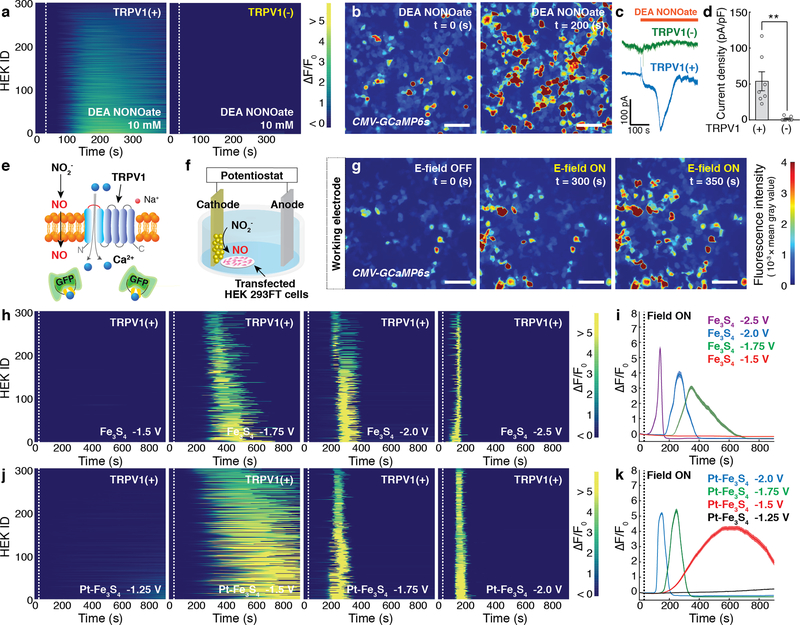
Fig. 2: Electrochemically produced NO triggers TRPV1.
a, GCaMP6s fluorescence intensity in 300 TRPV1+ (Left) or TRPV1– (Right) HEK293FT cells following addition of a NO donor, DEA NONOate (10 mM), at 30 s (dashed lines). b, Representative time-lapse images of global Ca2+ responses in TRPV1+ cells in response to the DEA NONOate infusion. Scale bar: 50 μm. c, Representative whole-cell patch-clamp traces of TRPV1+ cells (blue) and TRPV1- cells (green) in response to DEA NONOate infusion at the holding potential of – 40 mV. d, Peak current density (mean ± standard error of the mean (s.e.m.)) following DEA NONOate infusion in TRPV1+ cell or TRPV1- cells. A significant difference was observed between two groups, as confirmed by one-tailed Student’s t-test (n = 7 cells for each group, ** (p = 0.0038) < 0.01). e, A schematic illustrating Ca2+ influx through TRPV1 mediated by electrochemically produced NO. f, Experimental scheme for the electrochemical NO-delivery in vitro. g, Representative time-lapse images of Ca2+ influx into TRPV1+ cells evoked by the Fe3S4-catalysed NO generation at –1.75 V vs Pt. The cathode decorated with the Fe3S4 nanocatalysts was positioned at the left edge in all the images. Scale bar: 50 μm. (a, b, and g) The experiment was repeated three times independently with similar results. h-k, Individual (h, j) and averaged (i, k) GCaMP6s fluorescence traces for TRPV1+ cells (n = 300 cells for each trace) in the presence of Fe3S4 (h, i) and the Pt-Fe3S4 (j, k) nanocatalysts and 0.1 M NaNO2. Voltages of –1.5, –1.75, –2.0, –2.5 V and –1.25, –1.5, –1.75, –2.0 V vs Pt were applied at 30 s (dashed lines) in the presence of Fe3S4 and Pt-Fe3S4 nanocatalysts, respectively. i, k, Solid lines, and shaded areas indicate the mean and s.e.m., respectively. F0 indicates the mean of the fluorescence intensity during the initial 10 s of measurement.

