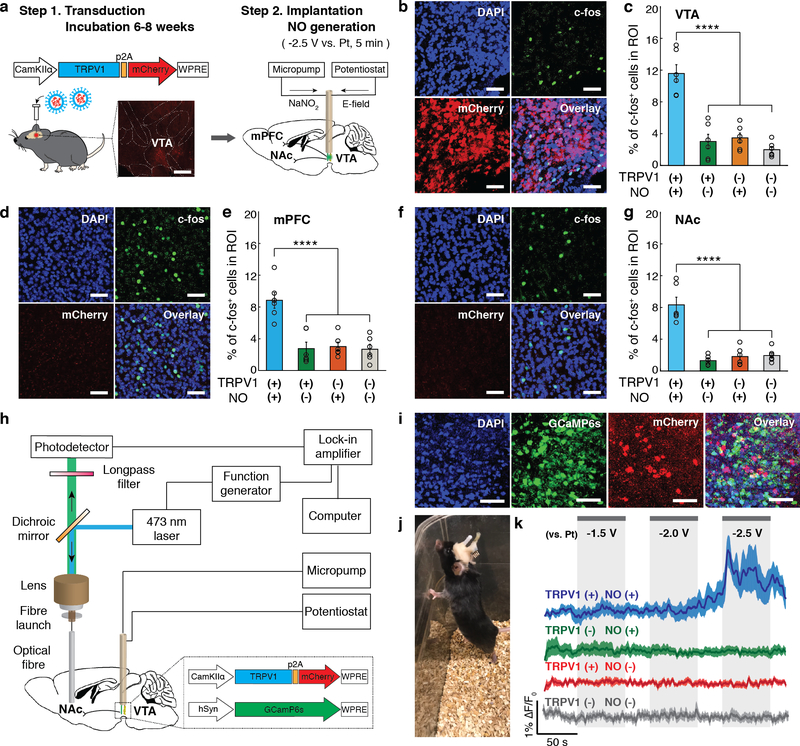
Fig. 5: Neuronal stimulation mediated by NO-delivery via implanted fibres in vivo.
a, An illustration of the virus-assisted gene delivery, fibre implantation, and NO generation in the mouse brain. Inset: A confocal image of TRPV1-p2A-mCherry expression in the mouse VTA. Scale bar: 500 μm. b-g, Confocal images (in TRPV1+ mice) (b, d, and f) and percentages of the c-fos expressing neurons among DAPI-labeled cells (mean ± s.e.m.) (c, e, and g) in the region of interest (ROI) in the VTA (b, c), mPFC (d, e), and NAc (f, g) following electrocatalytic NO generation in the VTA. Scale bar: 50 μm. Statistical significance of an increase in c-fos expression after NO generation in TRPV1+ mice as compared to controls was confirmed by one-way ANOVA and Tukey’s multiple comparison tests (n = 6 mice, VTA F3,20 = 29.97 p = 1.3 × 10⁻⁷, mPFC F3,20 = 15.49 p = 1.92 × 10⁻⁵, NAc F3,20 = 33.54 p = 5.4 × 10⁻⁸, **** p < 0.0001). h, An illustration of the fibre photometry setup integrated with the micropump and potentiostat for NO generation. i, Representative confocal microscope images of a mouse VTA co-expressing GCaMP6s and TRPV1-p2A-mCherry. Scale bar: 50 μm. The experiment was repeated three times independently with similar results. j, A mouse implanted with a NO-delivery fibre in the VTA and an optical fibre in the NAc. k, Normalized GCaMP6s fluorescence traces in the NAc of the anesthetized TRPV1+ (blue) and TRPV1– (green) mice in the presence of NO generation and the NAc of TRPV1+ (red) and TRPV1- mice (gray) in the presence of voltage alone (no NaNO2 infusion). Solid lines and shaded areas indicate the mean and s.e.m., respectively (n = 5 mice per condition). F0 indicates the mean of the fluorescence intensity during the initial 10 s of measurement.

