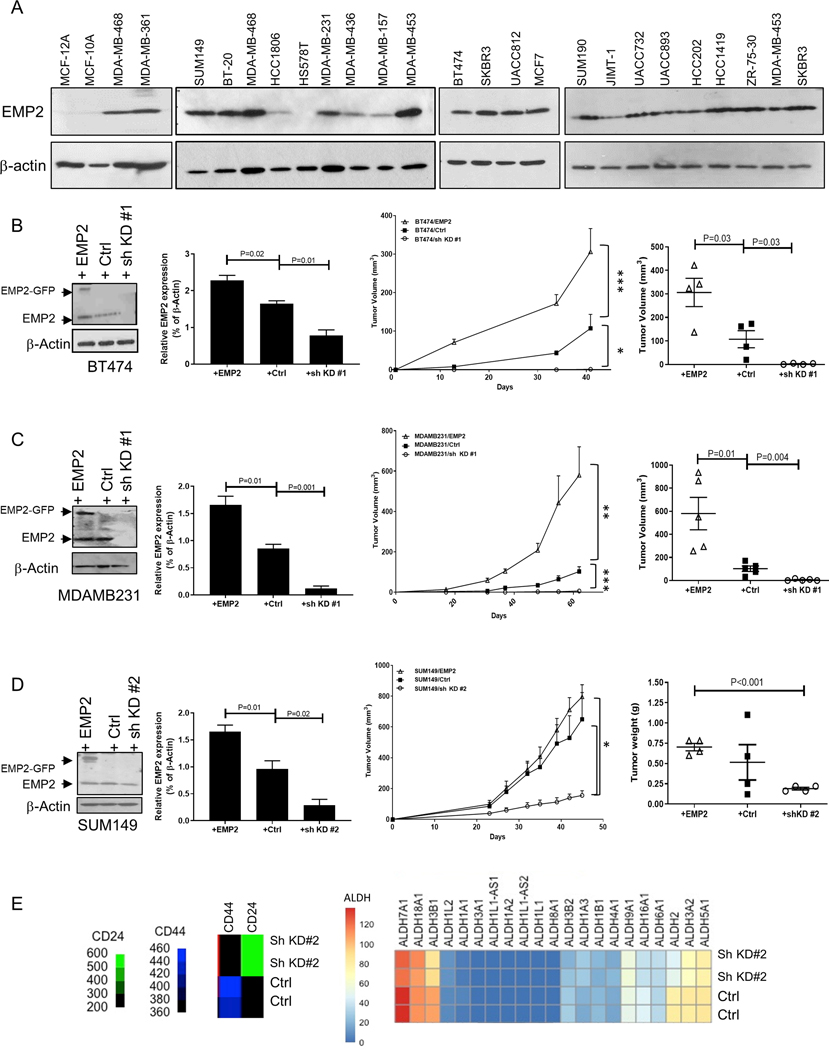
Figure 1: EMP2 expression promotes tumor growth.

A. A panel of normal mammary cell lines and breast cancer cell lines (MCF10A and MCF12A) representing the major molecular subtypes were tested for EMP2 expression with β-Actin used as a loading control. B. To determine the role of EMP2 in tumorigenesis, BT474 breast cancer cells with high EMP2, endogenous, or low levels (downregulation through sh KD #1) were injected in Balb/c nude mice. Quantitation of EMP2 expression in the different cell lines is depicted on the left. The growth of the cells over 40 days is shown in the middle, with final tumor volumes illustrated on the right. N=4. Significance was determined using 2 way ANOVA, p<0.0001, and results from Bonferroni’s multiple comparisons test shown on the figure. C. MDA-MB-231 cells with modified EMP2 levels as above were injected into Balb/c nude mice and measured over 62 days. Significance using a 2-way ANOVA, p=0.0004. Bonferroni’s multiple comparisons was used tested post hoc with results shown on the figure. N=5. Right, Final tumor volumes are highlighted. D. EMP2 expression in SUM149 cells were modified to overexpress or reduce EMP2 levels (sh KD#2) compared to a vector control. Cells were injected into Balb/c nude mice, and tumor load monitored over 45 days. Significance using a 2-way ANOVA, p=0.009. Post hoc analysis using Bonferroni’s multiple comparisons test is shown on the figure. N=4. Right, Graph illustrates final tumor weights. E. Transcriptomic data showing differential expression in SUM149 cell line infected with a vector control or shRNA lentiviral vector (sh KD #2). TMM normalized read counts per million were utilized to generate a heatmap based on differential expression of CD44, CD24, and various ALDH isoforms. EMP2 significantly altered the expression of multiple ALDH isoforms, and it was associated with increased CD24 and reduced CD44. *, indicates p<0.05.
