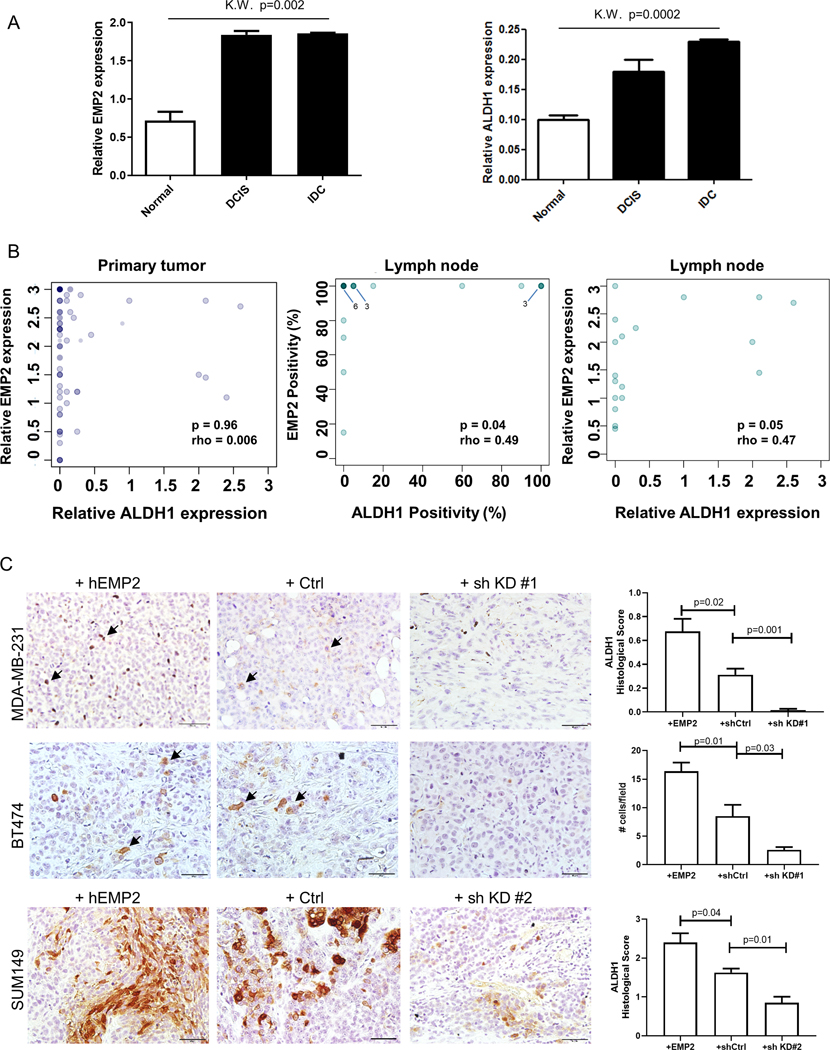
Figure 4. ALDH1 and EMP2 are co-expressed.

A. EMP2 and ALDH1 expression were measured in a tissue microarray from 62 women with invasive ductal carcinoma. Relative expression measures both the percentage of positive cells and the intensity of their staining, with a maximum score of 3. EMP2 and ALDH1 expression were significantly upregulated in cancer compared to adjacent normal tissue (p=0.002 and p=0.0002, respectively; Kruskal Wallis). Within the same patient, no significant differences were observed in DCIS relative to IDC for both ALDH1 and EMP2. B. Correlation of EMP2 and ALDH1 in patient samples. While all ALDH1 positive tumors were EMP2 positive, the relative expression of EMP2 did not correlate with that of ALDH1 in the primary tumor (N=47). Middle, A significant correlation between the percentage of ALDH1 and EMP2 cells occurred within lymph node metastasis (p=0.04; N=19). Right, This correlation was also significant when expression intensity was included (p=0.05). In all graphs, the intensity of color (darkness) is proportional to the number of samples at a given location. C. ALDH1 expression (brown) was measured in MDA-MB-231, BT474, and SUM149 xenografts that overexpress EMP2, express a vector control or express EMP2 shRNA knockdown tumors. Representative images are shown at a 400X magnification, with some ALDH1 positive cells highlighted with arrows. Scale bar = 50μM. N=4 with results shown as the mean ± SEM.
