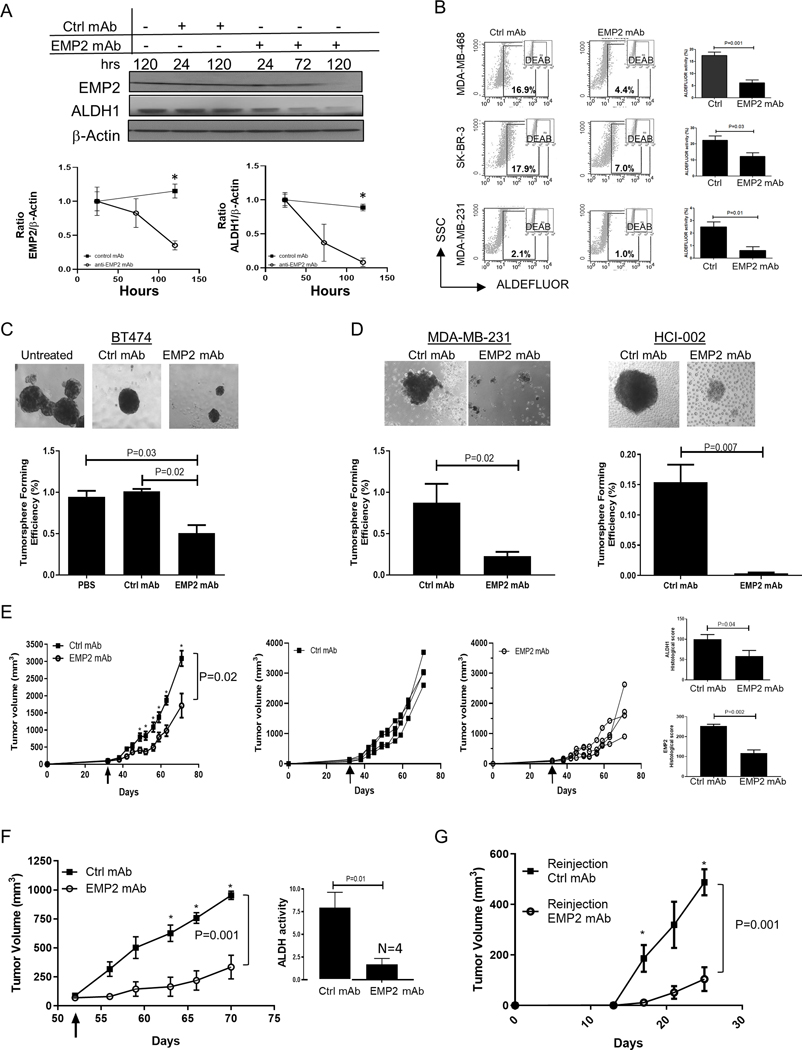
Figure 5. Anti-EMP2 mAbs reduce markers associated with stemness.

A. MDA-MB-468 cells were treated with 50μg/ml of anti-EMP2 or control human mAbs, and cell lysates were probed by Western blot analysis for EMP2 or ALDH1 expression for up to 120 hrs. Lower panels: Densiometric analysis of Western blots for expression of EMP2 or ALDH1 relative to β-actin. Samples were normalized to the 24 hours controls. N=3. *, p<0.05 by Student’s t test. B. MDA-MB-468, SKBR3, MDA-MB-231 cells were treated with 50μg/ml anti-EMP2 or control mAbs (anti-CD20) for 24 hours to monitor ALDH activity via the ALDEFLUOR assay. Diethylaminobenzaldehyde or DEAB, a specific inhibitor of ALDH, was used as a negative control. The graphs represent the average ± SEM of ALDH activity following treatment with control or anti-EMP2 mAbs from three independent experiments. C. Left panel, 5000 BT474 cells were left untreated, treated with 50 μg/ml control human or treated with anti-EMP2 mAbs and cultured for two weeks under low adherence conditions. Tumorspheres were enumerated, with representative examples shown. Below, quantitation of three independent experiments showing the average tumorsphere forming efficiency ± SEM, with significance determined using Student’s t test. Magnification=100X. D. MDA-MB-231 or HCI-002 cells were isolated from xenografts created in nude or NOD-SCID animals, respectively. Isolated cells (5000) were cultured in triplicate and treated as above with control human mAbs or anti-EMP2 mAbs. The graphs below represent the averaged results ± SEM from triplicate samples prepared from two independent experiments. Magnification=100X. E. The triple negative primary tumorgraft HCI-002 was implanted into the mammary fat pad of NOD-SCID animals. Grouped and individual data are provided for animals treated with 10mg/kg twice a week with either control mAbs or an anti-EMP2 mAb. N=4. The arrow denotes when tumor treatment was initiated. Two way ANOVA, p=0.02. *, significance by Bonferroni’s multiple comparisons test. Right panels, At day 71, tumors were harvested, fixed, and stained for ALDH1 or EMP2 expression using standard immunohistochemistry. The graphs show the average immunohistochemical intensity of each protein, ± SEM. N=4. Significance was determined using Student’s t test. F. 1×10⁶ MDA-MB-231 cells were implanted into the mammary fat pad of Balb/c nude mice. When tumors averaged 80–100mm3, they were grouped and treated with human control or anti-EMP2 mAbs at 10mg/kg twice a week. N=4. Two way ANOVA, p=0.001. *, significance by Bonferroni’s multiple comparisons test. Right, Following treatment, tumors were dissociated, and some of the cells monitored for ALDH activity via the ALDEFLUOR assy. Results are expressed as the average ± SEM. N=4. G. A single cell suspension of the resected primary tumor initially treated with control or anti-EMP2 mAbs was reinjected into secondary animals at either 500, 5000, or 50,000 cells. No additional treatments were given. In animals reinjected with 50,000 cells, tumor load was monitored and the mean± SEM illustrated. N=4. Two way ANOVA, p=0.001. *, significance by Bonferroni’s multiple comparisons test.
