
Figure 8:
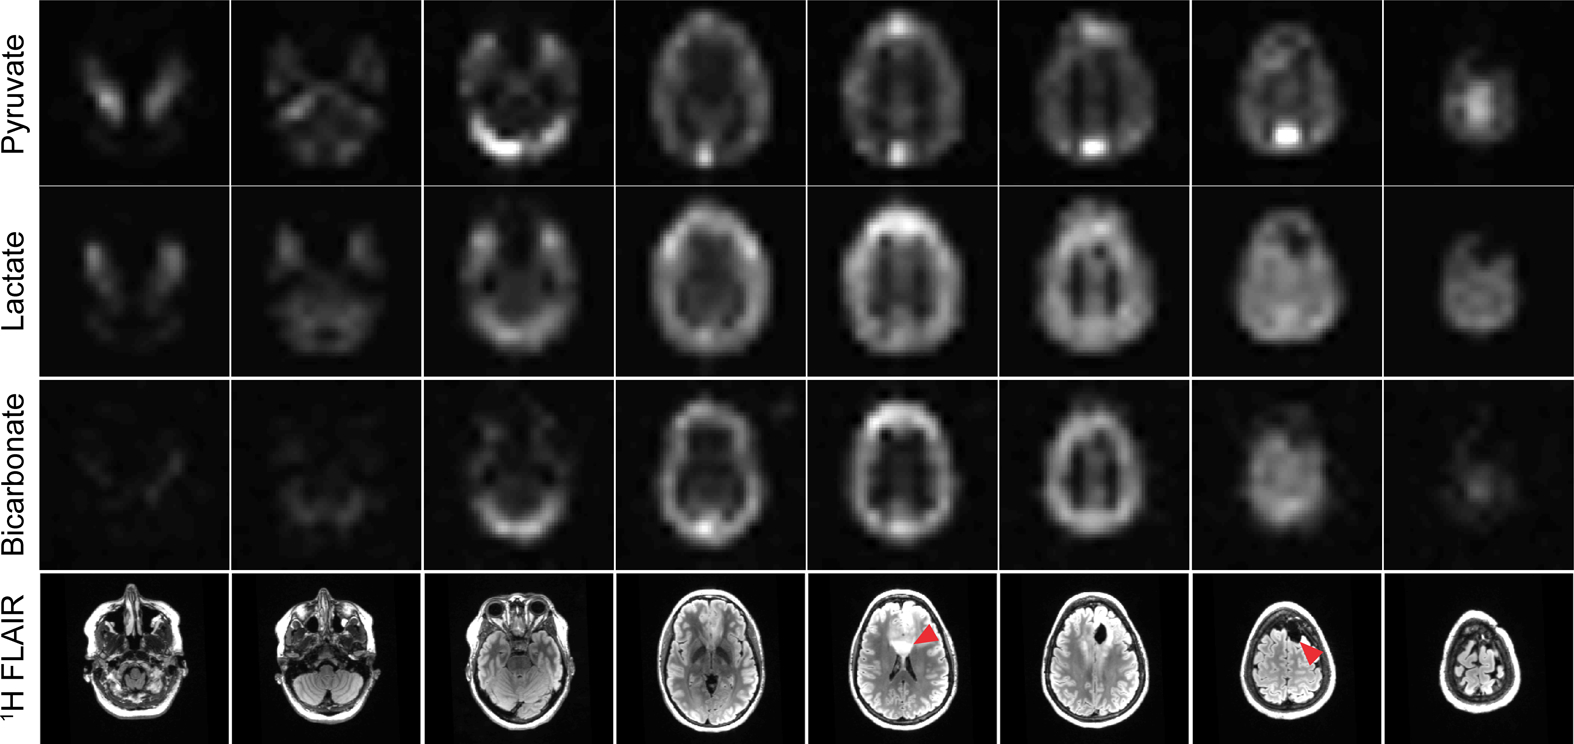
Area under the curve (sum through time) images of pyruvate, lactate, and bicarbonate for the eight slices covering the entire brain. In this experiment, a spectral-spatial RF pulse was used to separately excite each metabolite, which was then encoded with a single-shot echoplanar readout. Artifact-free data can be acquired with rapid imaging readouts in the clinical setting, enabling volumetric coverage of the whole brain with a temporal resolution (3 s) equivalent to that of single slice EPSI. Figure adapted from Ref (64).