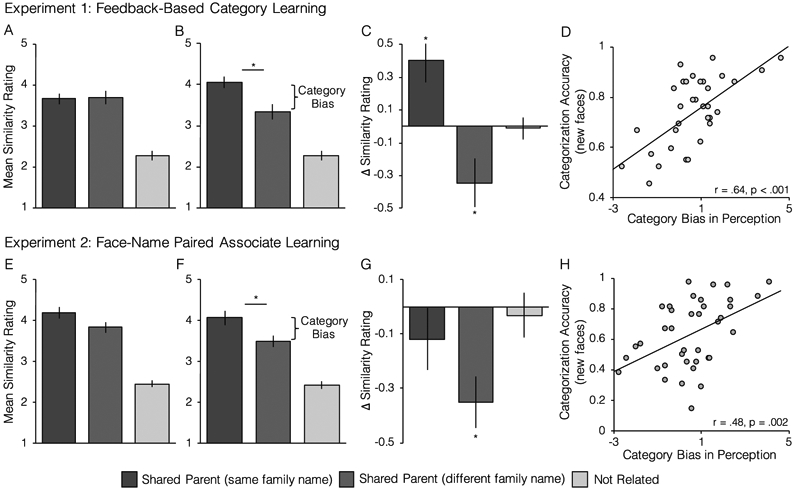
Figure 2.

Top panel are results from the traditional category learning experiment. Bottom panel (shaded grey) are results from the face-name paired associate learning experiment. A & E. Average similarity ratings for faces that share a parent and family name, faces that only share a parent, and faces that don’t share any parents before learning. B & F. Average similarity ratings for the same pairwise comparisons after learning. Asterisk represents a significant (p < .05) difference in post-learning similarity ratings for faces that belong to the same family vs. faces that share physical similarity but belong to different families (i.e. a category bias in perception). C & G. Changes in similarity ratings from pre- to post-learning. Asterisk denotes significant (p < .05) increases and decreases in perceived similarity for faces. D & H. Positive relationship between indirect (category bias in perception) and direct (categorization accuracy for new faces) measures of memory generalization.
