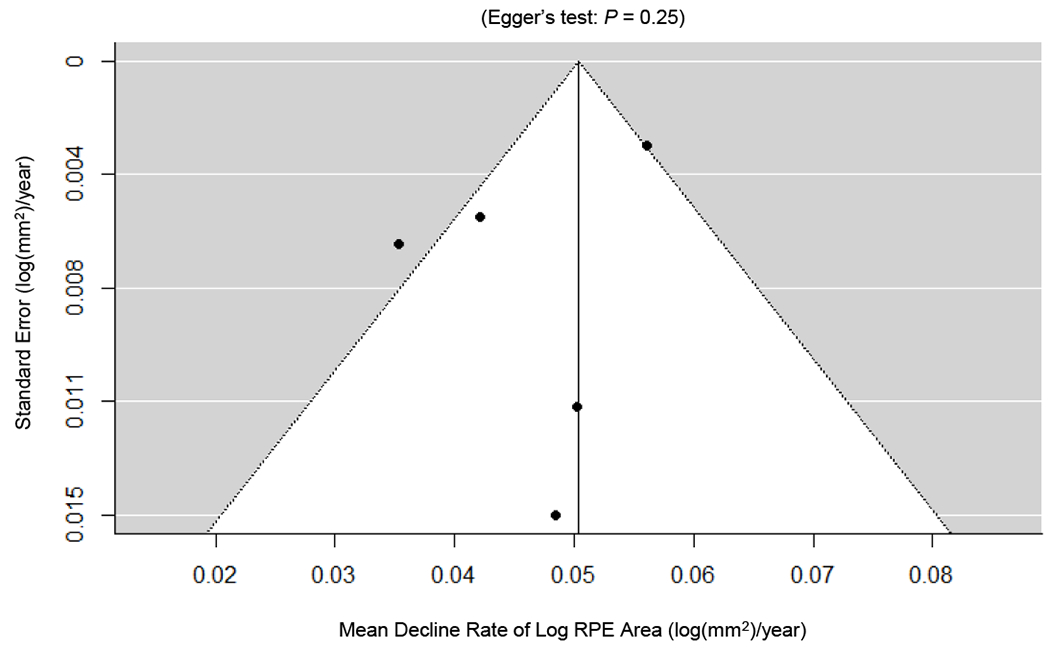
Figure 5.

Publication biases as assessed by funnel plots and Egger’s test. Each circle represents a standard error at a mean decline rate of log area of retinal pigment epithelium (RPE) in an included study with longitudinal data. The vertical line represents the estimate of mean value of the decline rate of log RPE area, and the diagonal lines are pseudo 95% confidence intervals. We did not find any evidence of significant publication bias in the reported decline rate of residual RPE, as demonstrated by the symmetrical funnel plots and Egger’s test (P = 0.25).
