
Figure 5. Identifying E-P aggregates associated with neurogenesis.
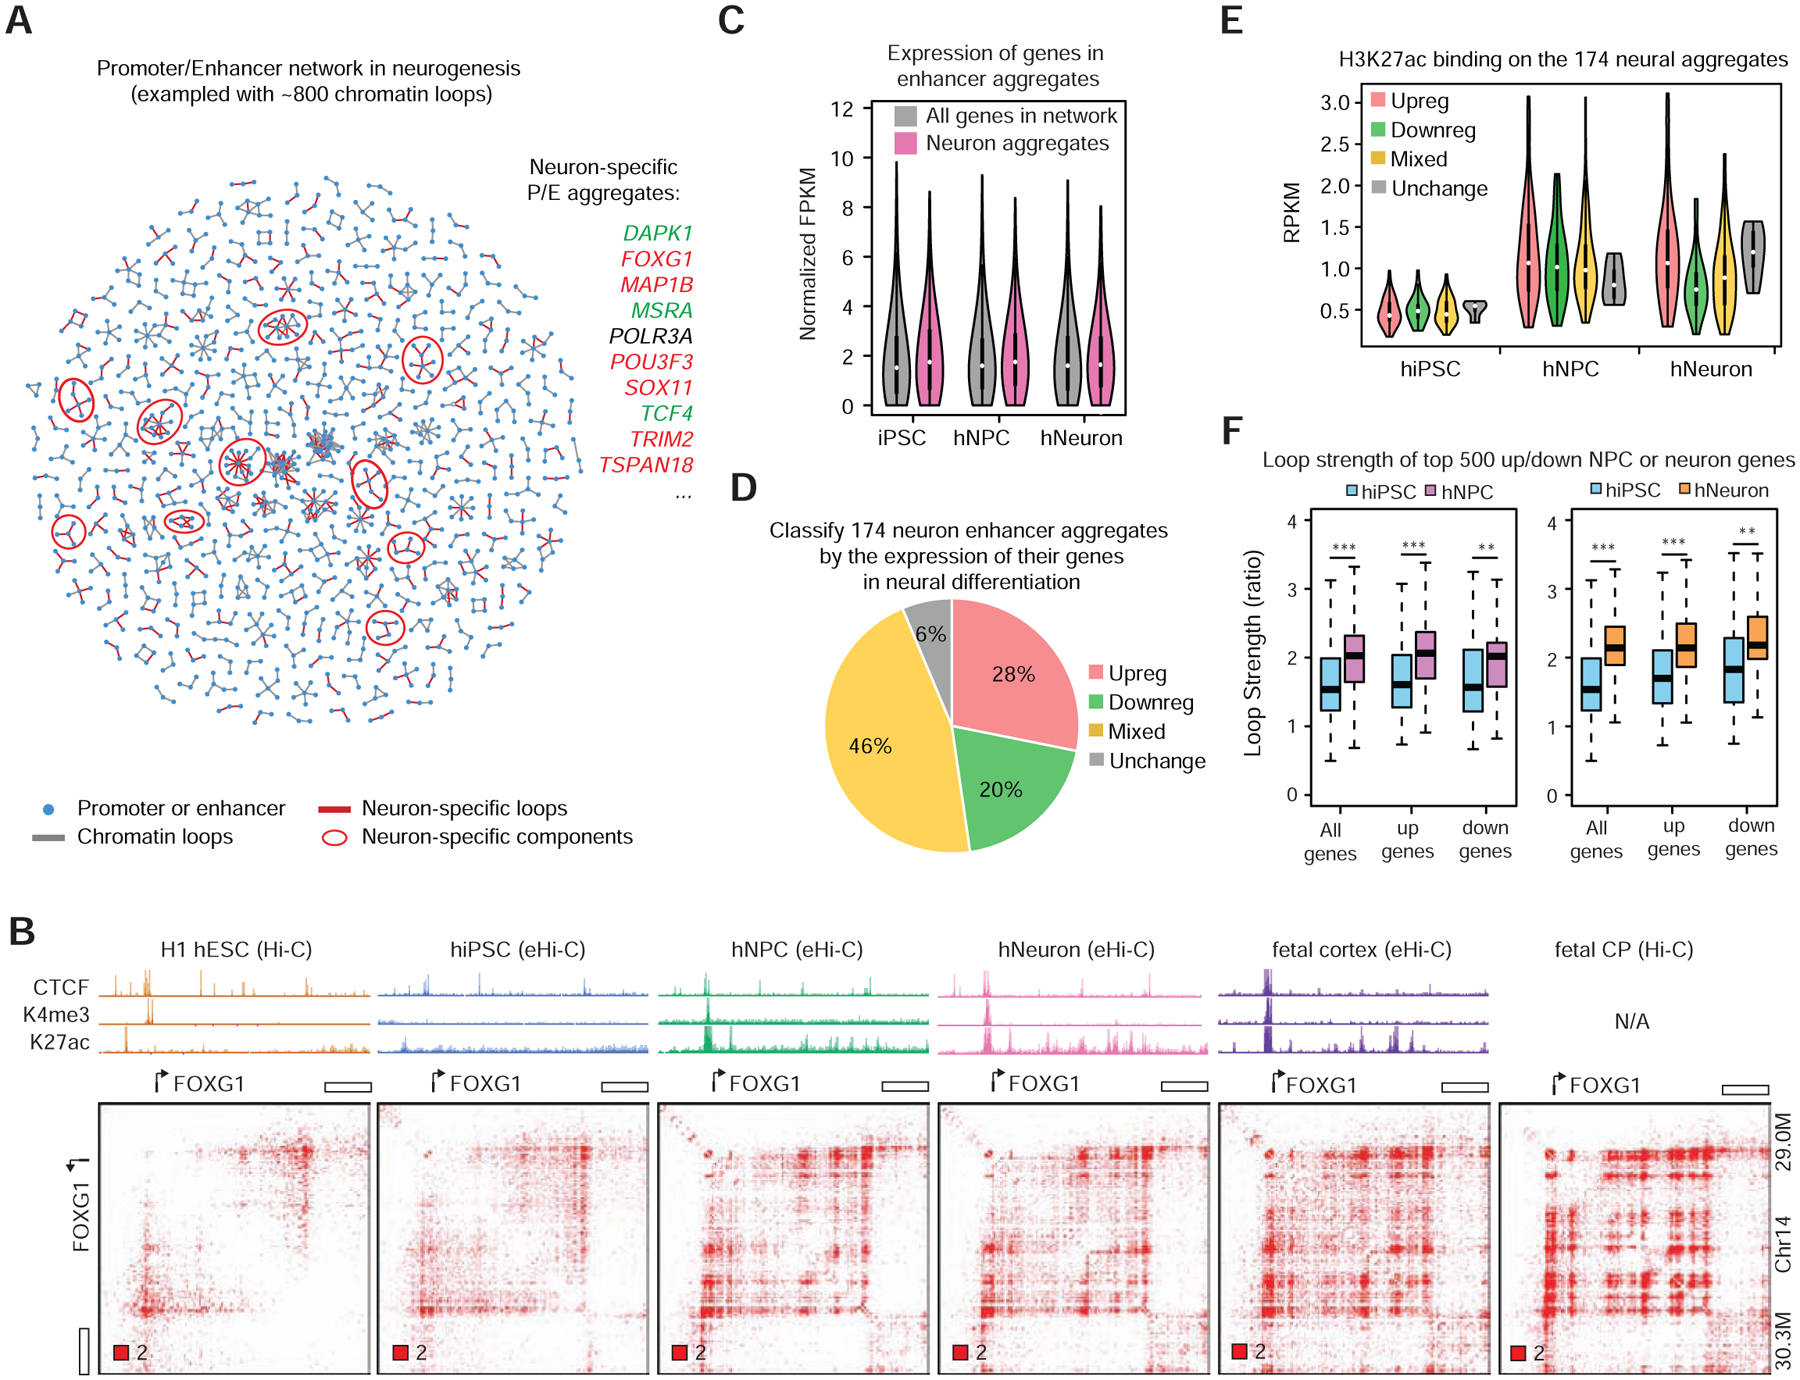
A, An exemplary enhancer-promoter network with ~800 chromatin loops during neurogenesis. Neuron-specific network components can be identified as candidate neuronal enhancer aggregates. Genes in a few neural enhancer aggregates are listed on the right: red, upregulated in neural differentiation, green, downregulated. B, Formation of enhancer aggregate at the FOXG1 locus during neural differentiation. C, Summary of gene expression in neural enhancer aggregates. D, Classification of neural enhancer aggregates based on their dynamic gene expression during differentiation. E, H3K27ac occupancy at different categories of neural enhancer aggregates. F, Compare the strength (ratio) of loop pixels at the differentially expressed genes (DEGs). Top 500 DEGs were picked by comparing hNPC (left) or hNeuron (right) to hiPSC. ***, p < 0.001; **, p< 0.01 Wilcoxon rank-sum test.