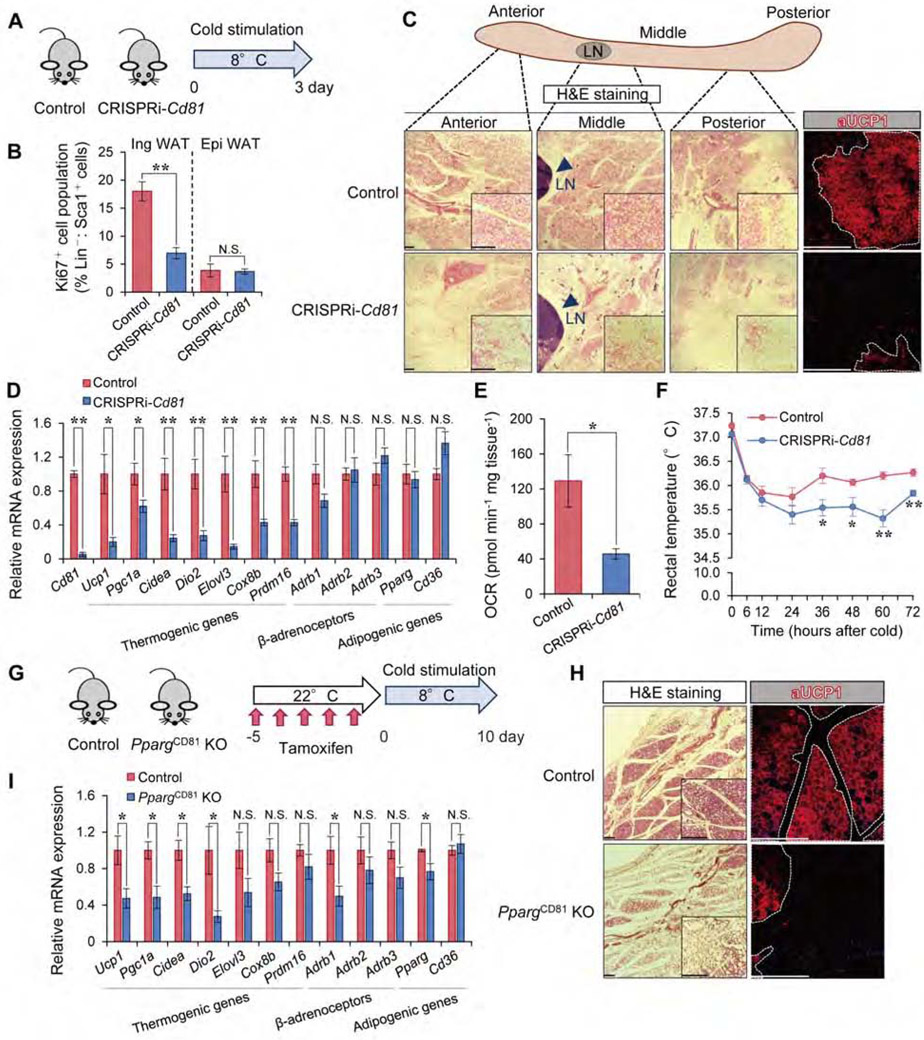
Figure 5. CD81 is required for de novo beige fat biogenesis.
A) Illustration of the experiments in (B-E).
B) Ki67+ cells (%) in Lin−: Sca1+ stromal cells from the Ing WAT and Epi WAT in (A). n=5.
C) H&E staining and UCP1 immunofluorescent staining in the Ing WAT in (A). Arrowhead indicates lymph node (LN). Scale bar = 200 μm.
D) mRNA expression of indicated genes in the Ing WAT in (A). n=5.
E) OCR in the Ing WAT in (A). Control, n=3; CRISPRi-Cd81, n=4.
F) Rectal core body temperature of indicated mice following cold exposure. Control, n=6; CRISPRi-Cd81, n=5. *P < 0.05, **P < 0.01 by two-way repeated measures ANOVA with post hoc test by unpaired Student’s t-test.
G) Illustration of the experiments in (H-I).
H) H&E staining and UCP1 immunofluorescent staining in the middle region of Ing WAT in (G). Scale bar = 200 μm.
I) mRNA expression of indicated genes in the Ing WAT in (G). Control, n=5; PpargCD81 KO mice, n=4. (B, D, E, I) *P < 0.05, **P < 0.01 by unpaired Student’s t-test.
Data in (B, D, E, F, I) are represented as mean ± SEM.

