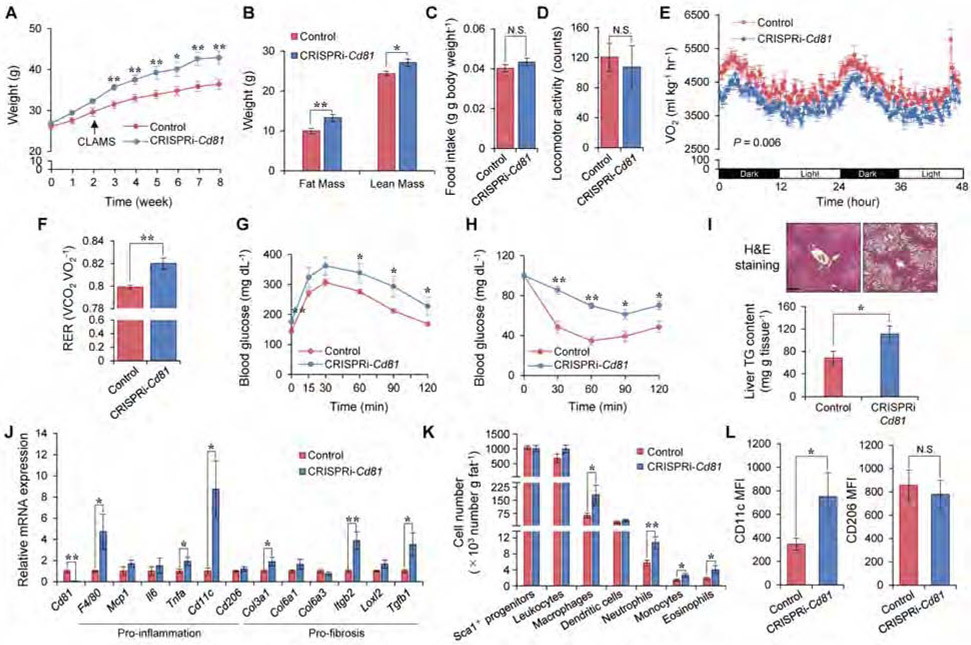
Figure 6. CD81 loss causes obesity, glucose intolerance, and adipose tissue inflammation.
A) Body-weight of indicated mice on HFD. Control, n=9; CRISPRi-Cd81, n=6.
B) Fat mass and lean mass of mice on 8 weeks of HFD. Control, n=9; CRISPRi-Cd81, n=6.
C) Food intake of mice on HFD. Control, n=8; CRISPRi-Cd81, n=6.
D) Locomotor activity of mice in (C). (C, D) N.S., not significant by unpaired Student’s t-test.
E) Whole-body energy expenditure (VO2, ml kg−1 hr−1) of mice on 2 weeks of HFD. Control, n=8; CRISPRi-Cd81, n=6. P value by two-way repeated measures ANOVA.
F) RER of mice in (E).
G) GTT in mice on 8 weeks of HFD. Control, n=9; CRISPRi-Cd81, n=6.
H) ITT in mice in (G). (A, G, H) *P < 0.05, **P < 0.01 by two-way repeated measures ANOVA with post hoc test by unpaired Student’s t-test.
I) Top: H&E staining in the liver of mice on 10 weeks of HFD. Sale bar = 200 μm. Bottom: TG contents. Control, n=9; CRISPRi-Cd81, n=6.
J) mRNA expression of pro-inflammatory and pro-fibrosis genes in the Ing WAT of mice on 10 weeks of HFD. Control, n=7; CRISPRi-Cd81, n=6.
K) The number of total non-leukocyte stromal cells (CD45−: Sca1+), leukocytes (CD45+), macrophages (CD45+: CD64+), dendritic cells (CD45+: CD64−: CD11c+), neutrophils (CD45+: CD64−: Ly6G+), monocytes (CD45+: CD64−: Ly6C+), eosinophils (CD45+: CD64−: SiglecF+) per gram of the Ing WAT of mice on 10 weeks of HFD. Control, n=8-9; CRISPRi-Cd81, n=5-6.
L) The expression of M1-like macrophage marker (CD11c) and M2-like macrophage marker (CD206) among total macrophages in the Ing WAT from mice on 10 weeks of HFD. Control, n=9; CRISPRi-Cd81, n=6. (B, F, I, J, K, L) *P < 0.05, **P < 0.01 by unpaired Student’s t-test.
Data are represented as mean ± SEM.

