
Figure 4: Temporal differences in chromatin accessibility at cortical pREs.
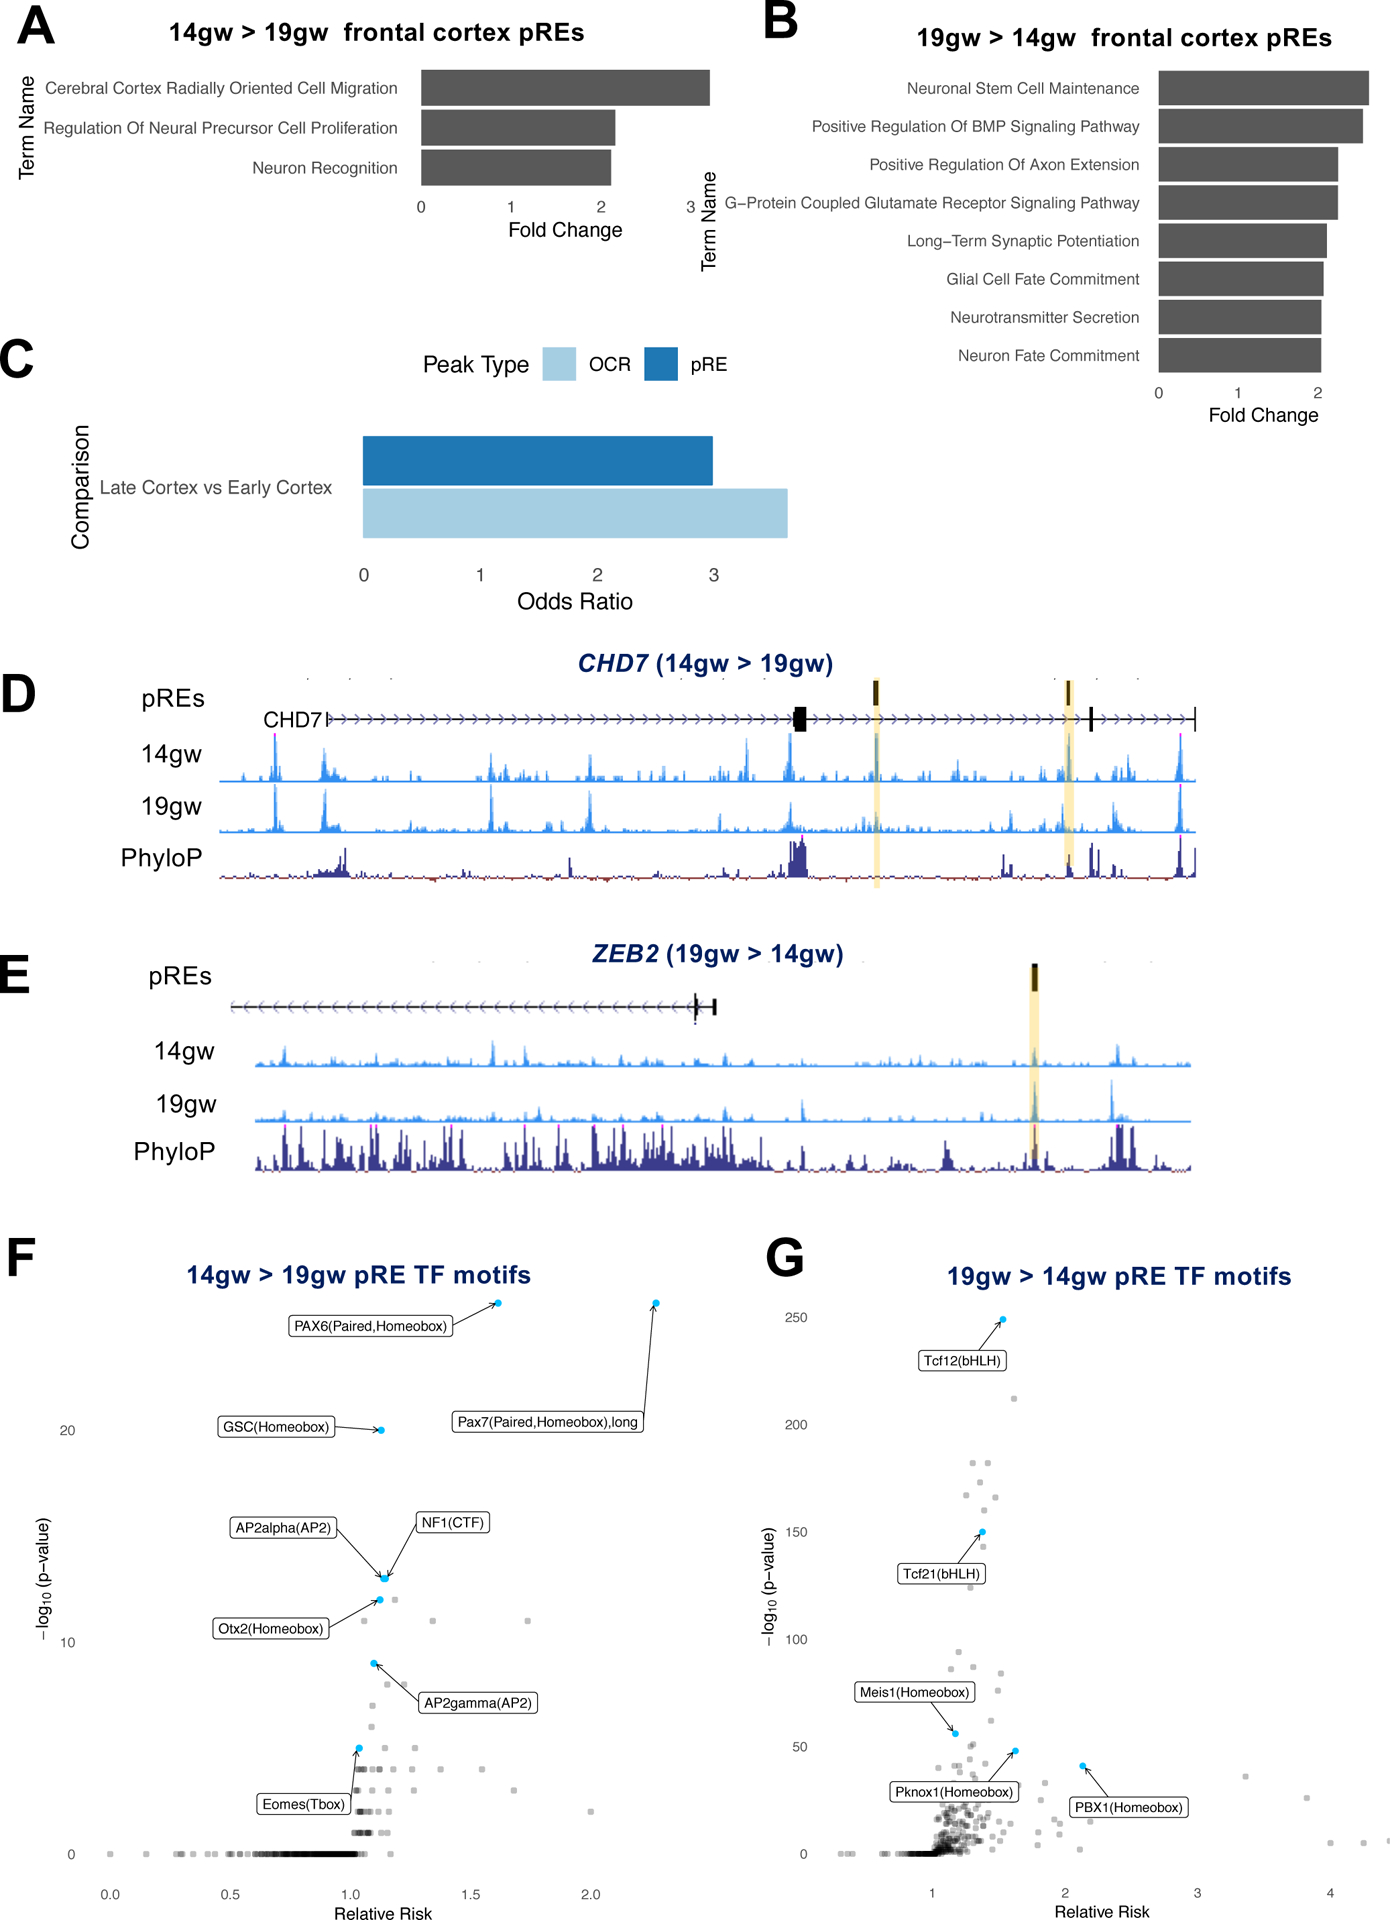
4A) GREAT analysis of functions associated with 14gw-specific pREs from frontal cortex tissues (combined PFC and motor samples).
4B) GREAT analysis of functions associated with 19gw-specific pREs from frontal cortex tissues.
4C) Genes differentially expressed in frontal cortex between 14gw and 19gw are enriched for 14gw- and 19gw-specific pREs and OCRs.
4D,E) ATAC-seq reads from 14gw and 19gw frontal cortex pooled samples. pREs are highlighted in yellow. The nearby genes are differentially expressed at 14gw and 19gw, respectively. Y axis scale is 0 to 50.
4F,G) Effect size and significance of TF motifs enriched in 14gw frontal cortex-specific pREs compared to 19gw-specific pREs, and vice versa.