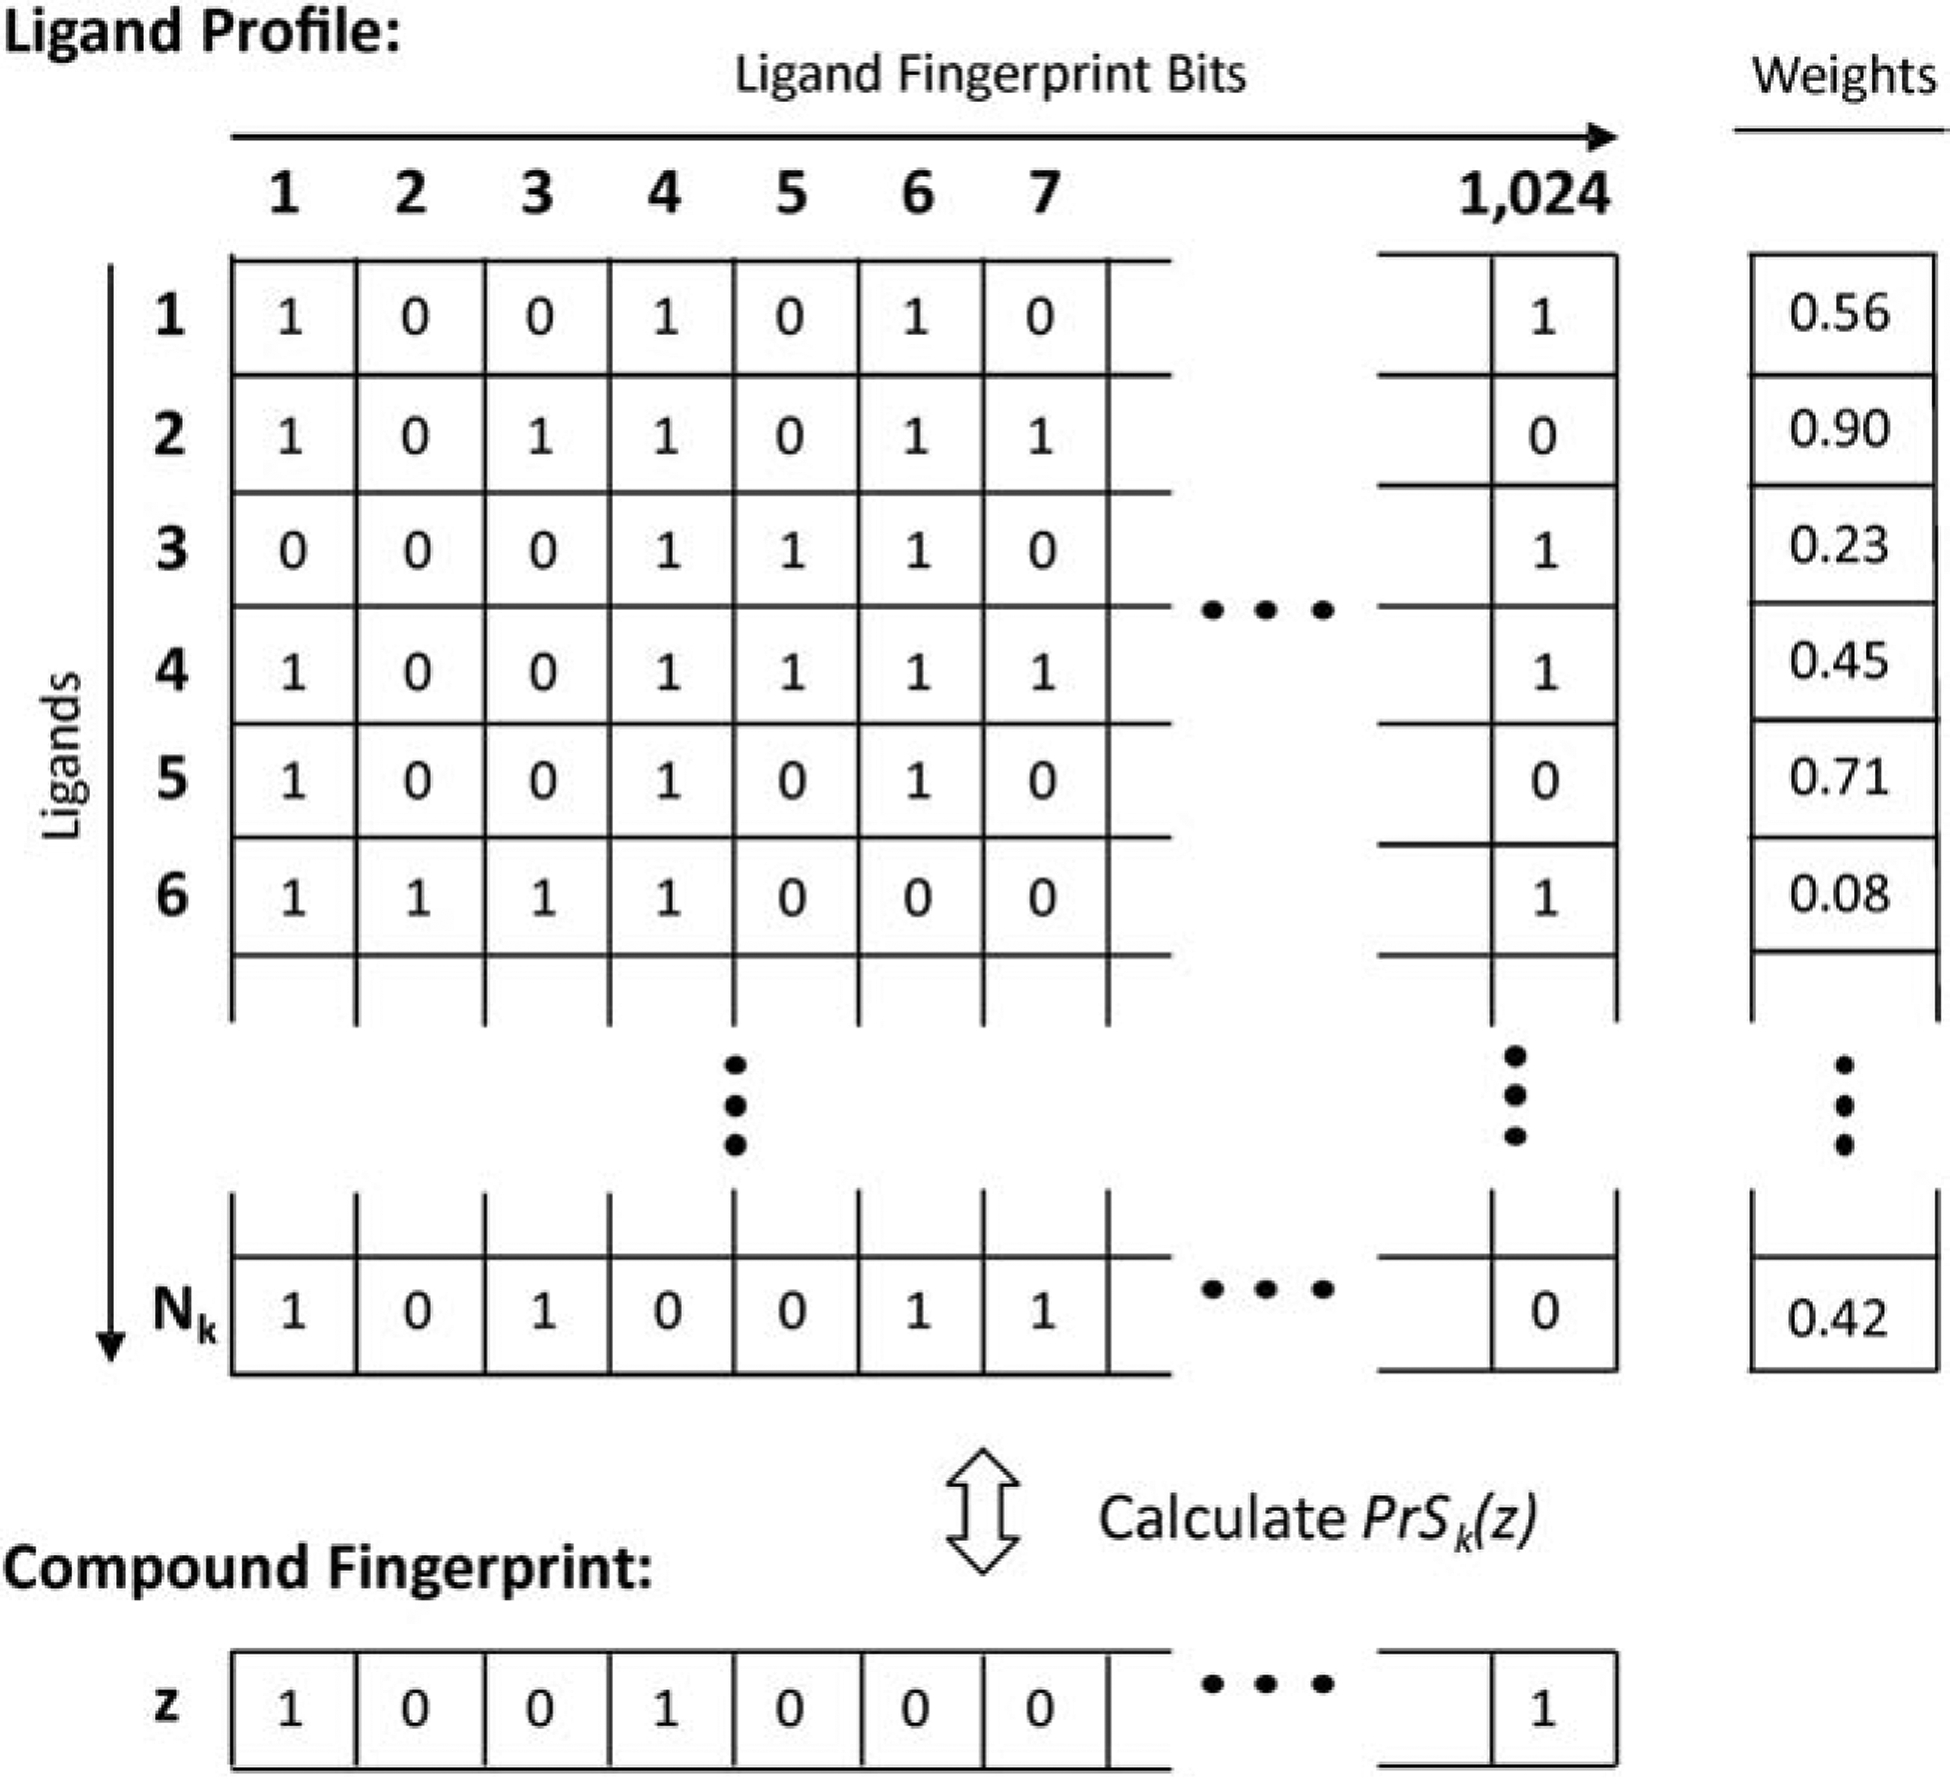
Figure 3.

Illustration of ligand profile that summarizes feature information of all ligands from the kth cluster. In the profile, the horizontal index represents the ligand fingerprint bits, while the vertical index runs through all ligands. Each ligand is assigned a weight (wi) that equals to the average alignment score of different modules that have been used to identify the GPCR template associated with the ligand. The bottom panel indicates a compound fingerprint from the ZINC database, with which the profile is aligned.
