


Figure 2. Inhibition of DGAT1, but not DGAT2, significantly suppresses TG and LD formation and induces GBM cell death.
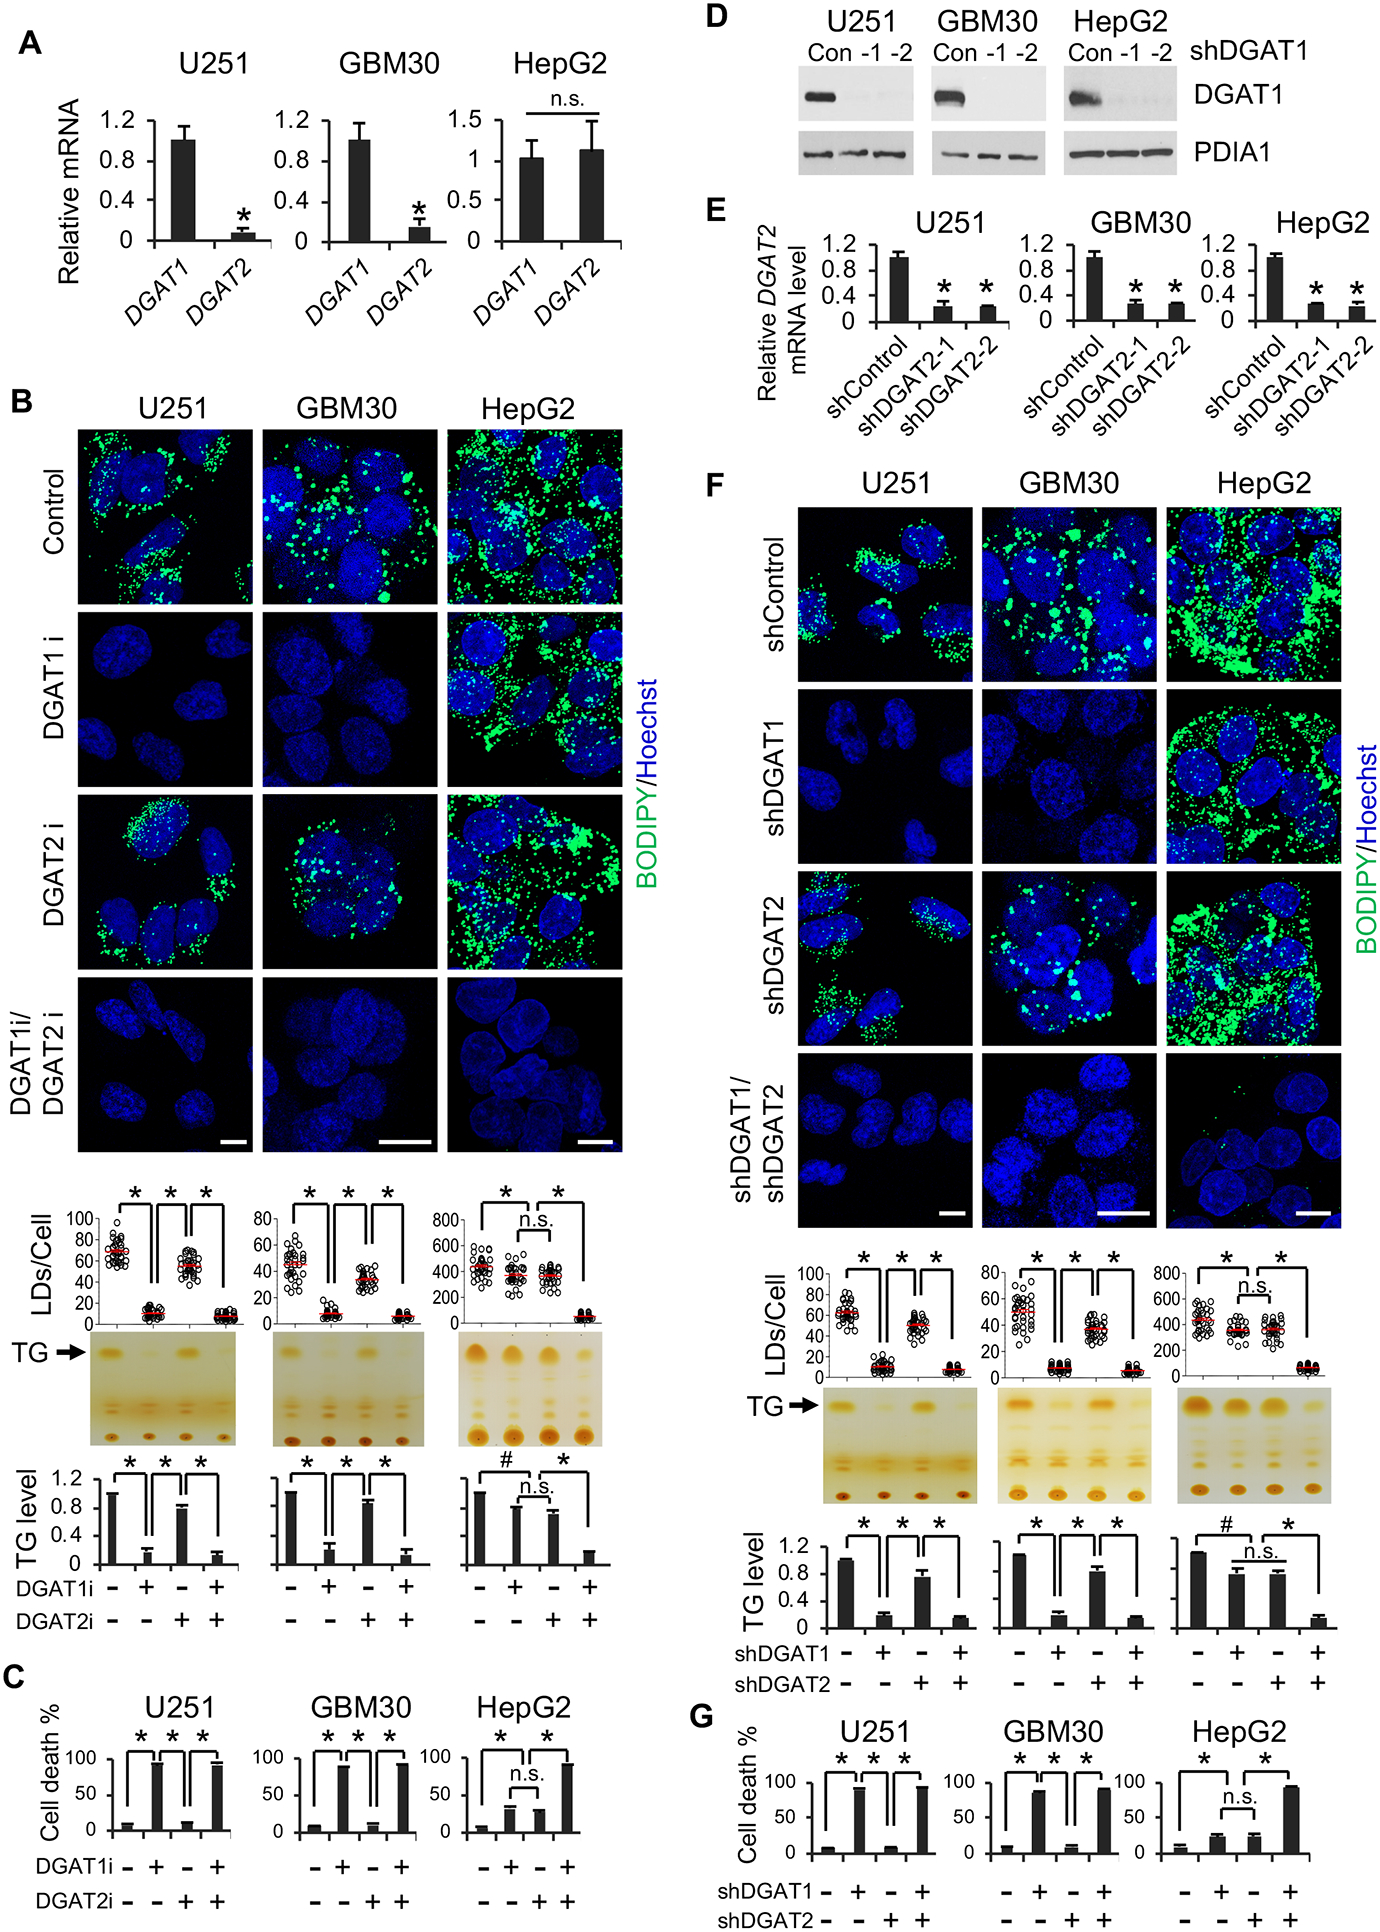
(A) RT-qPCR analysis of mRNA expression (mean ± SD, n = 3) in GBM cells (U251 and GBM30) and in liver cancer cell line (HepG2). *P < 0.01; n.s., not significant.
(B) Representative fluorescence imaging (n = 6 images in total) of LDs stained with BODIPY 493/503 (green) (upper panels) and TLC analysis (n = 3) of TG levels (lower panels) in different cancer cells treated with/without DGAT1 inhibitor A-922500 (20 μg/ml) or DGAT2 inhibitor PF-06424439 (20 μg/ml) for 24 hr. Nuclei were stained with Hoechst 33342 (blue). Scale bar, 10 μm. *P < 0.001; #P < 0.05.
(C) Percentage of dead cells (mean ± SD, n = 3) after treatment with DGAT1 or DGAT2 inhibitor for 3 days as in panel B. *P < 0.0001.
(D) A representative Western blot (n = 3 blots in total) of DGAT1 expression after shRNA knockdown for 48 hr.
(E) RT-qPCR analysis of DGAT2 mRNA expression (mean ± SD, n = 3) in different cancer cells after shRNA knockdown for 48 hr. *P < 0.01.
(F) Representative fluorescence imaging (n = 6 images in total) of LDs stained as panel B (upper panels) and TLC analysis of TG levels (lower panels) in different cancer cells after shRNA knockdown of DGAT1 or DGAT2 for 48 hr. Scale bar, 10 μm. *P < 0.001; #P < 0.05.
(G) Percentage of dead cells (mean ± SD, n = 3) after shRNA knockdown of DGAT1 or DGAT2 for 4 days. *P < 0.0001; #P < 0.001.
See also Figure S2.