
Figure 6. Genetic inhibition of DGAT1 significantly suppresses tumor growth and prolongs overall survival in GBM-bearing mice.
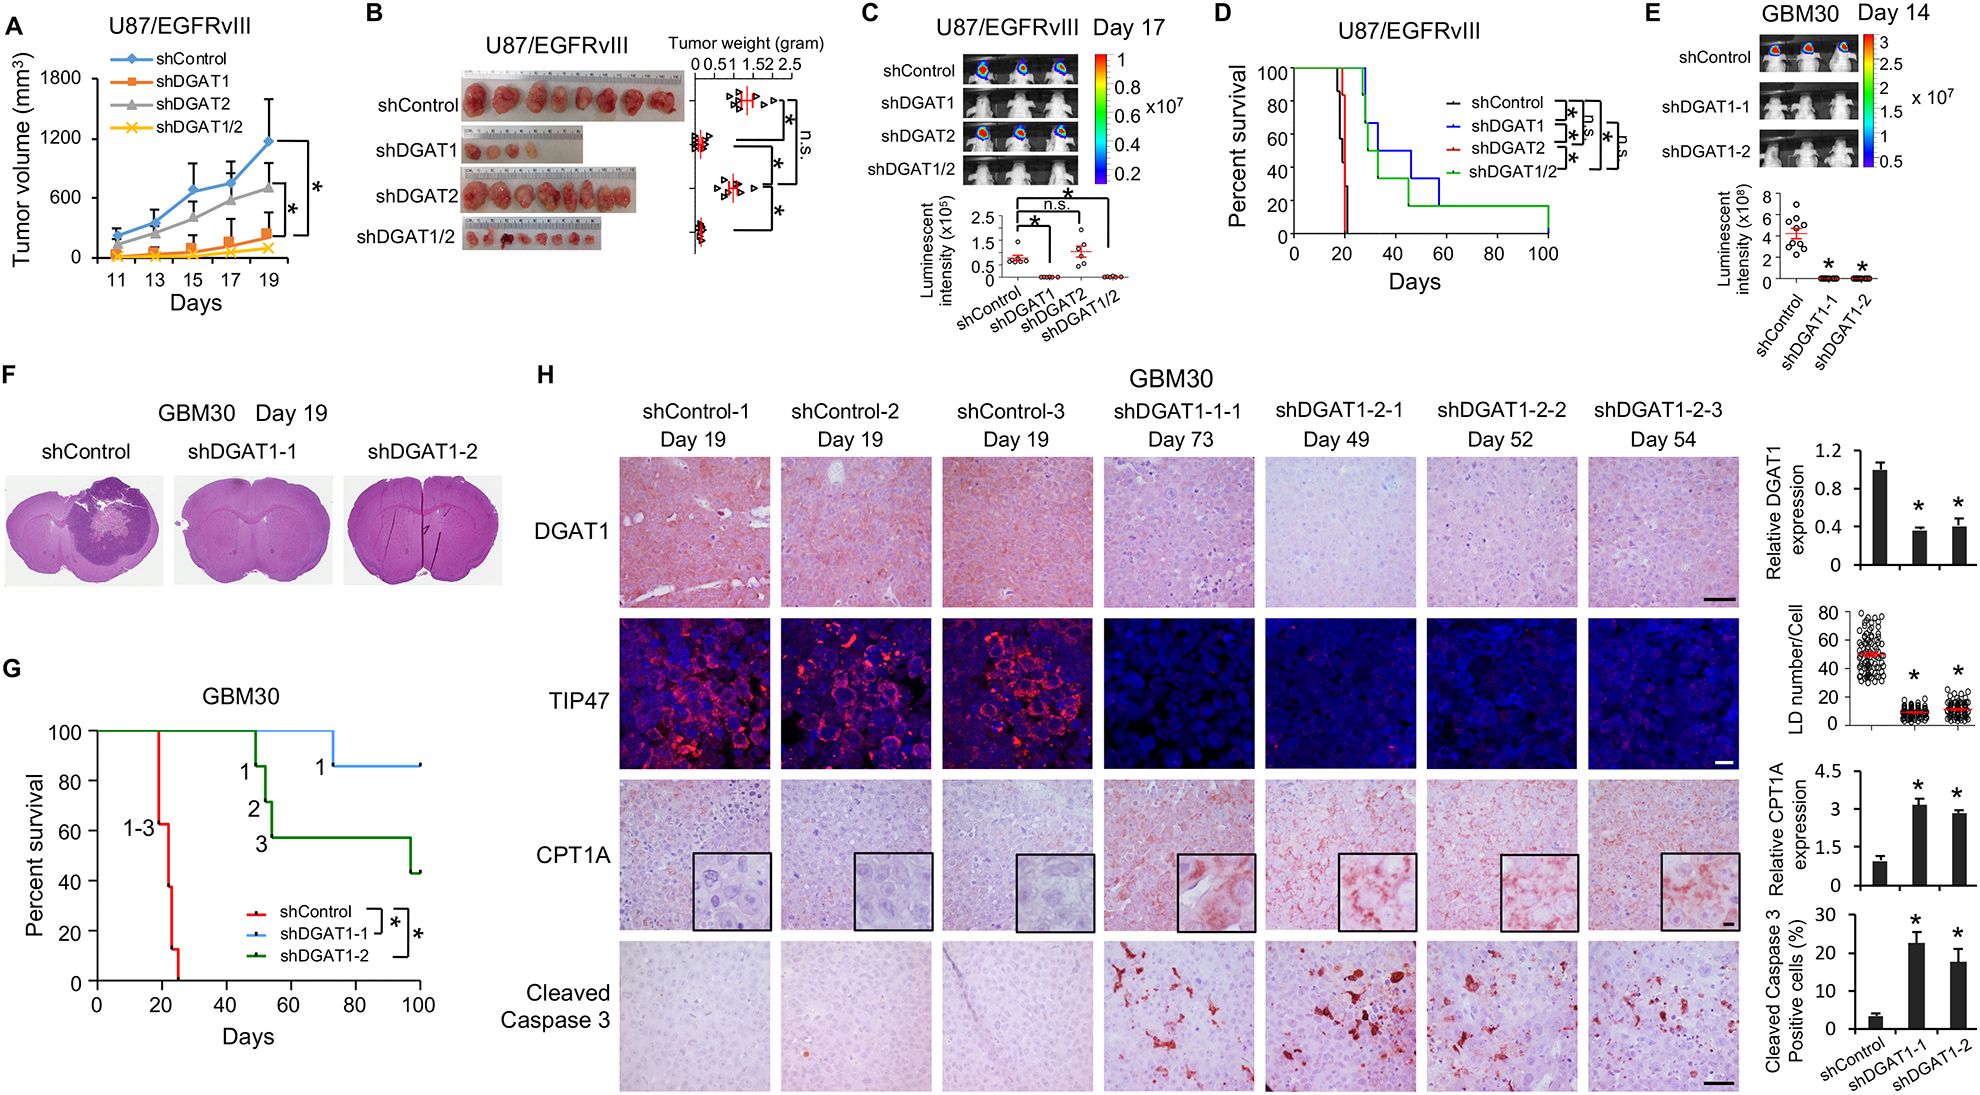
(A-D) The effects of knockdown of DGAT1 or DGAT2 in U87/EGFRvIII cells-derived subcutaneous (A and B) or intracranial (C and D) tumor models. Tumor growth in mouse brain was analyzed by bioluminescence imaging at day 17 post implantation (mean ± SEM, n = 7) (C). Mouse survival was assessed by Kaplan–Meier curves (D). *P < 0.0001.
(E-G) The effects of DGAT1 knockdown in primary GBM30-luciferase cells-derived intracranial mouse model. Tumor growth was analyzed by bioluminescence imaging at day 14 post implantation (mean ± SEM, n = 10) (E). Sections of mouse brain (n = 3) from day 19 post implantation were stained with H&E (F). Kaplan-Meier plot for analysis of mouse survival (n = 7)(G). The ‘1’, ‘2’ and ‘3’ in the panel G means the number of mice that reached to mortality stage and sacrificed for analysis in panel H. *P < 0.001.
(H) Representative imaging (n = 5 in total images) of IHC of DGAT1, CPT1A and cleaved Caspase 3 or IF of LDs via staining TIP47 in tumor tissues from the mice indicated in panel G and sacrificed at indicated days. Five separate areas from each tumor were quantified (mean ± SEM). Scale bars, 40 μm for IHC, 10 μm for IF. *P < 0.01
See also Figure S8.