
Figure 2:
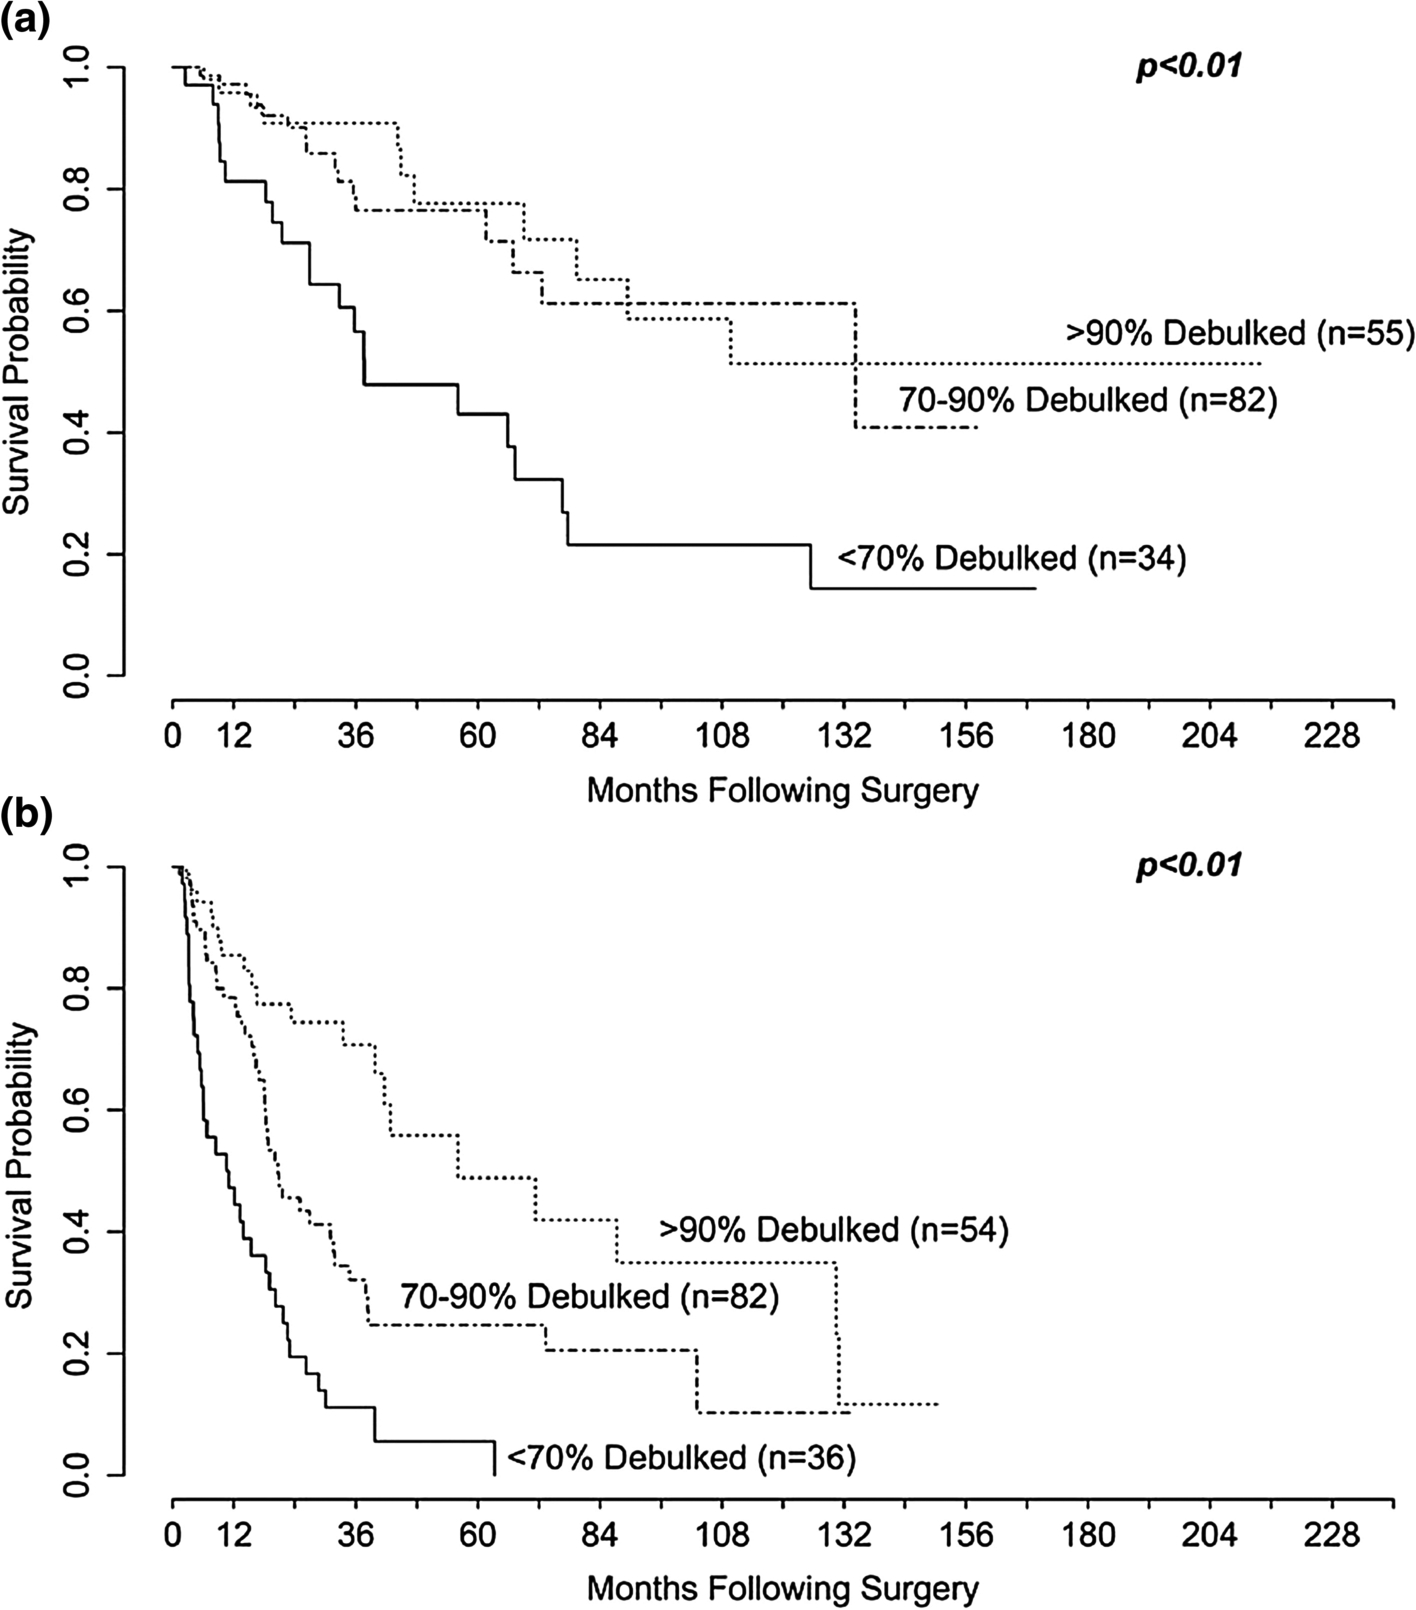
Kaplan-Meier curves for (A) Overall survival and (B) Progression free survival stratified by the amount of tumor debulked. There was a difference in (A) OS comparing <70% to 70%–90% (P < .01) but not 70%–90% to >90% (P = .6). There was a significant difference in (B) PFS comparing <70% to 70%–90% (P < .01) and 70%–90% to >90% (P < .01; reprinted from Scott et al.21 with permission).