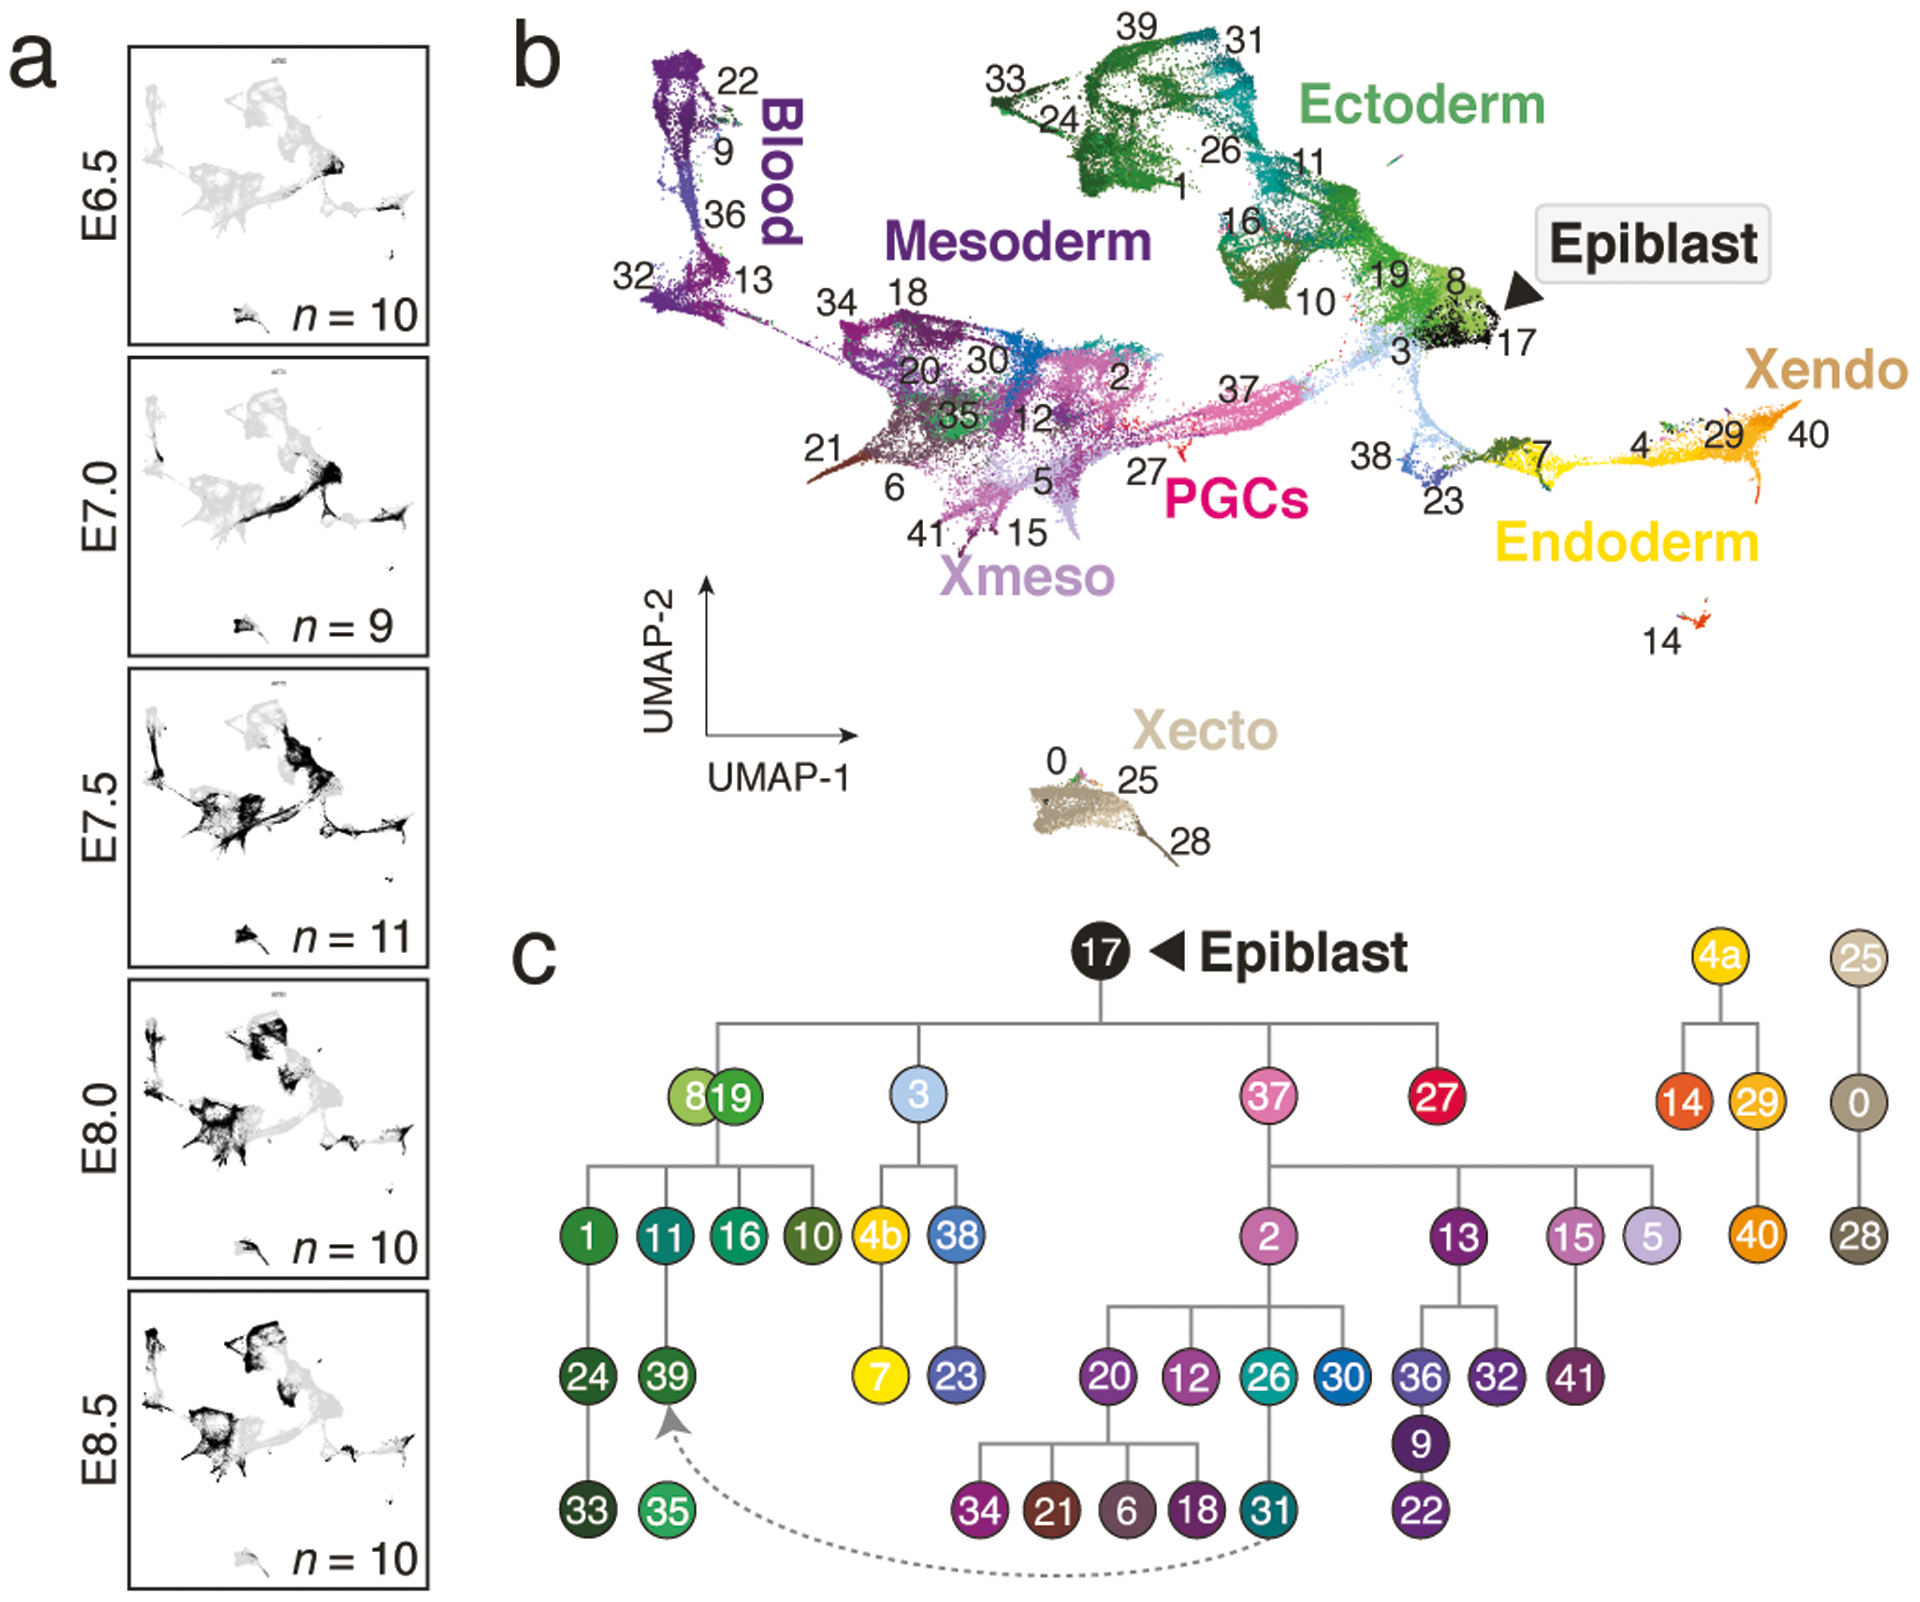
Figure 1. Single-cell profiling of early post-implantation development.

a. Uniform Manifold Approximation and Projection (UMAP) plots of 88,779 WT single-cell transcriptomes, separated by time point (black dots). n = replicate embryos
b. UMAP of our WT scRNA-seq time series from panel a. Numbers denote the 42 cell states, colors indicate states of the same major lineages.
c. Curated lineage tree of cell states. States were annotated and connected according to their emergence, marker gene expression, the literature and scRNA velocity (Extended Data Fig. 1h, i, Methods and Supplementary Text). Dashed arrow represents neuromesodermal progenitor (NMP)-containing states that are reported to contribute to neuroectoderm39. Extraembryonic ectoderm and endoderm are disconnected to reflect their preimplantation origins23.
0:extraembryonic ectoderm late, 1:neural ectoderm anterior, 2:primitive streak late, 3:streak pre-specified|anterior, 4:endoderm primitive(a)|definitive(b), 5:allantois, 6:2° heart field|splanchnic lateral plate, 7:gut, 8:ectoderm early 1, 9:primitive blood early, 10:preplacodal ectoderm, 11:neural ectoderm progenitor, 12:posterior lateral plate mesoderm, 13:hematopoeitic|endothethial progenitor, 14:parietal endoderm, 15:amnion mesoderm early, 16:surface ectoderm, 17:epiblast, 18:somites, 19:ectoderm early 2, 20:splanchnic-lateral|anterior-paraxial mesoderm, 21:primitive heart tube, 22:primitive blood late, 23:notochord, 24:fore|midbrain, 25:extraembryonic ectoderm early, 26:NMPs early, 27:PGCs, 28:differentiated trophoblasts, 29:visceral endoderm early, 30:presomitic mesoderm, 31:NMPs late, 32:angioblasts, 33:neural crest, 34:pharyngeal arch mesoderm, 35:similar to neural crest, 36:primitive blood progenitor, 37:primitive streak early, 38:node, 39:future spinal cord, 40:visceral endoderm late, 41:amnion mesoderm late. Note, “state 35:similar to neural crest” is not enriched for specific markers but most closely resembles “33:neural crest.” It is disconnected from the tree to reflect this ambiguity.
