
Extended Data Figure 7. Molecular abnormalities of Polycomb group regulator mutants.
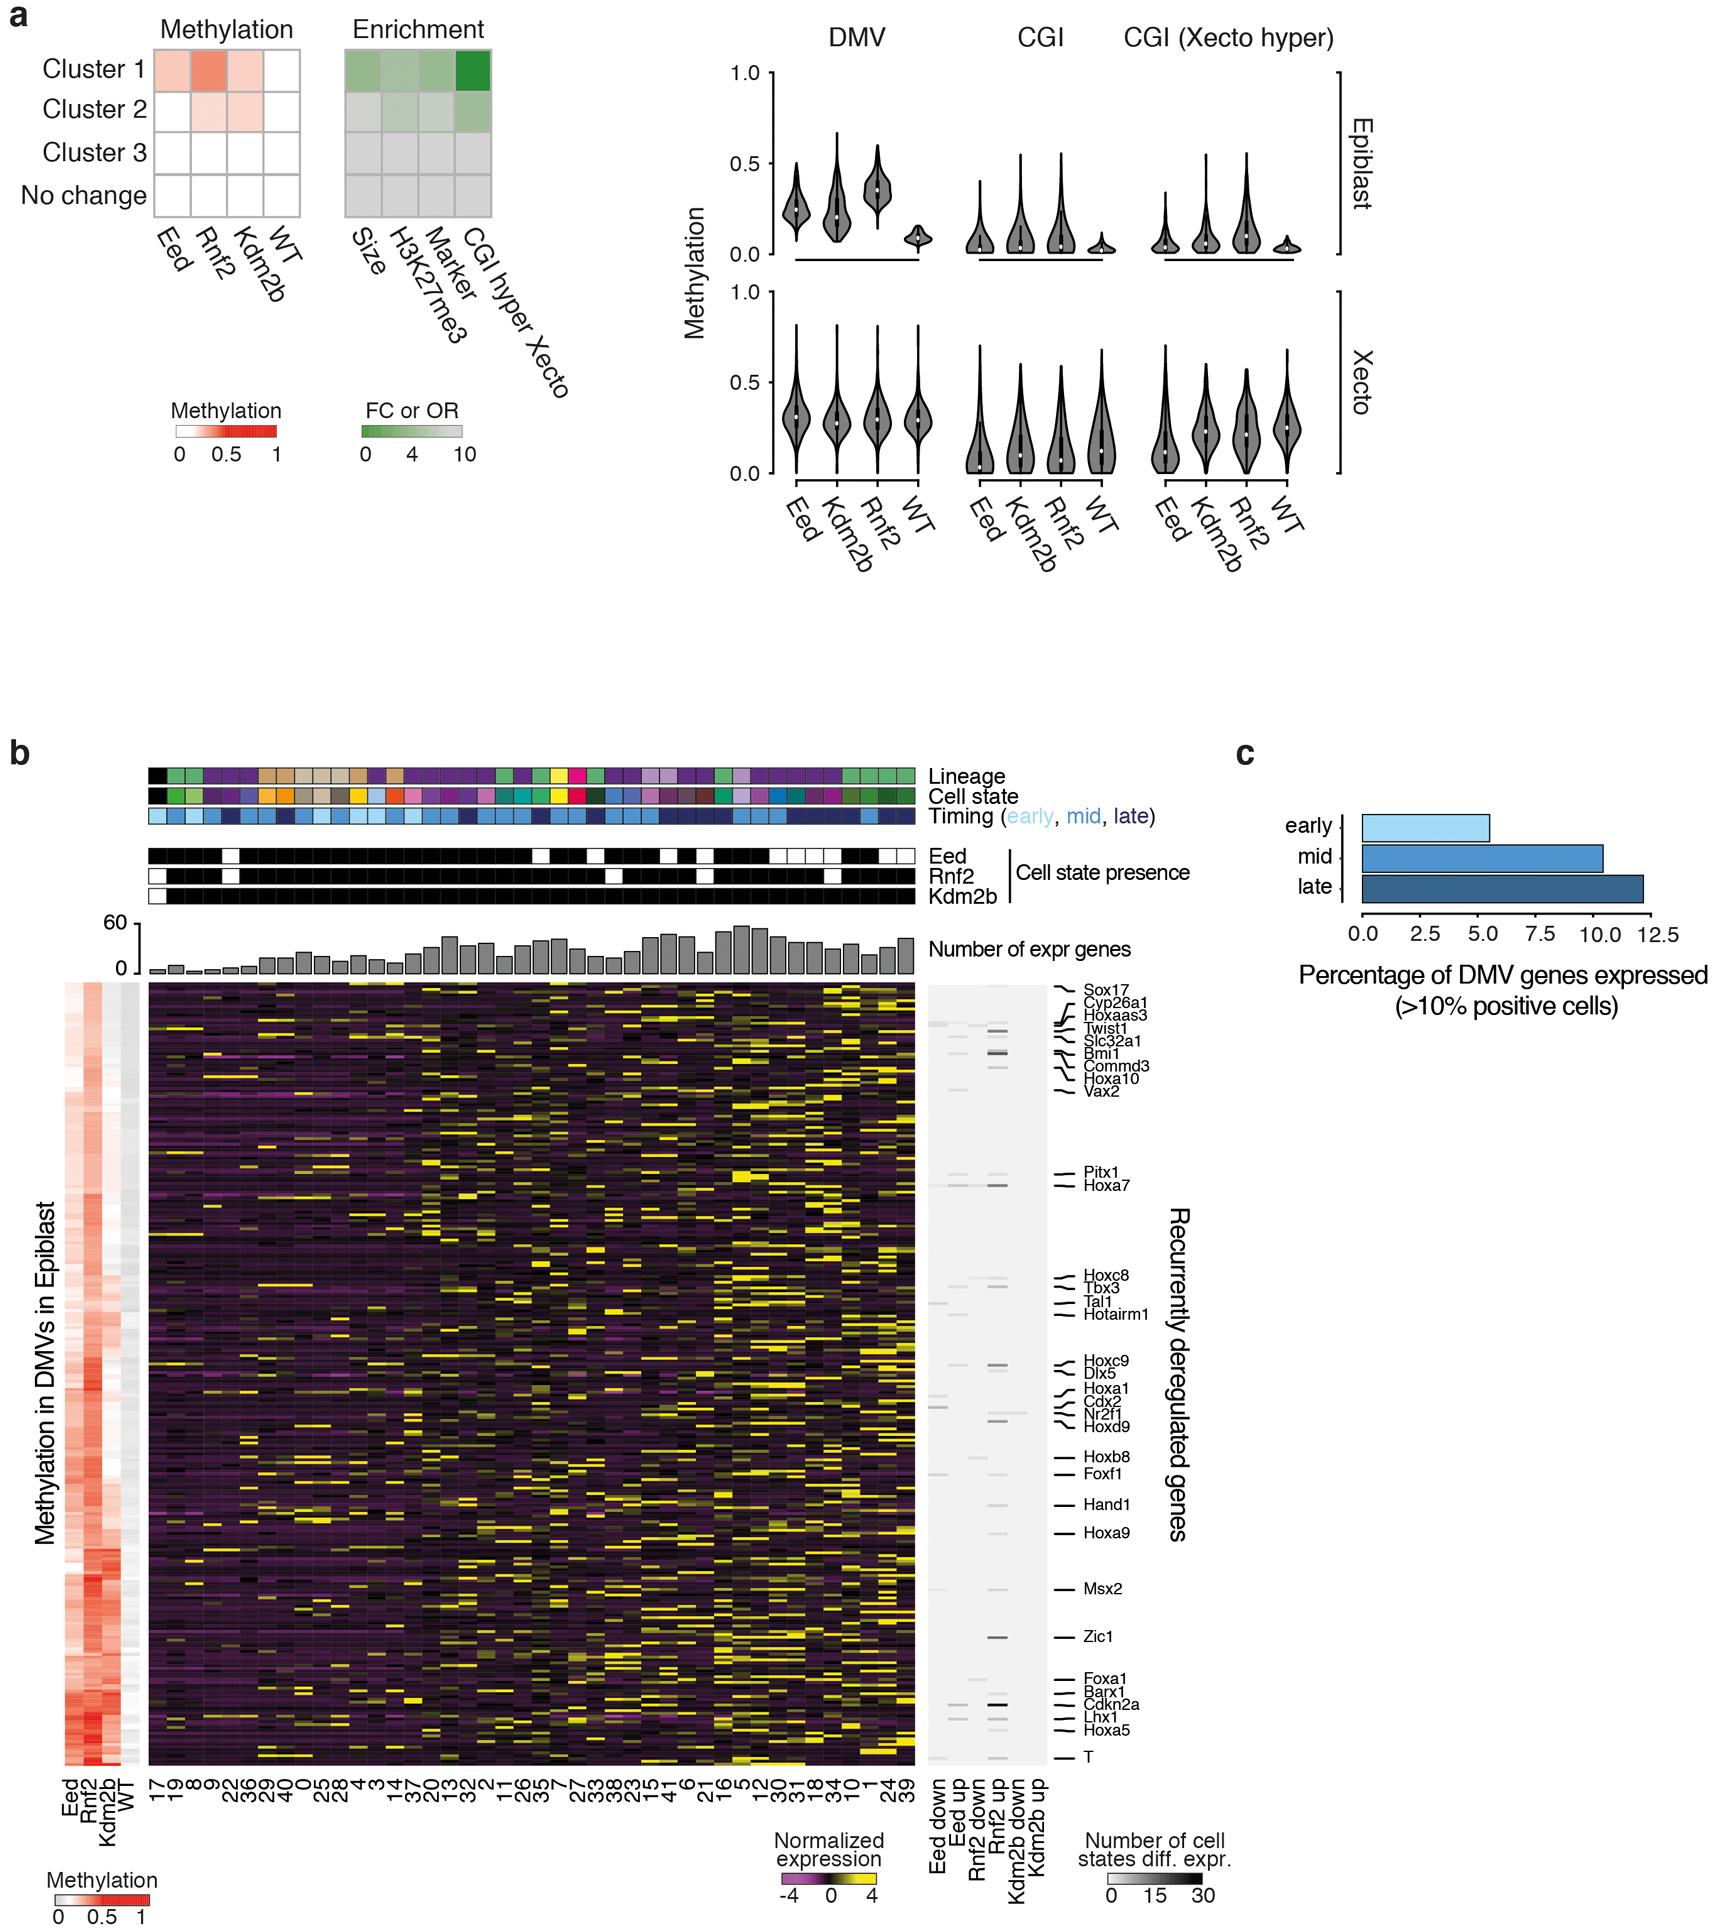
a. Left: Large, multi-kb DNA methylation valleys (DMVs) associated with developmental genes gain DNA methylation in PRC KOs. We clustered 8,972 DMVs that exist within the WT E6.5 epiblast according to their methylation in our PRC KOs. A discrete set of 248 is specifically methylated within our Eed, Rnf2, and Kdm2b KOs (cluster 1). Compared to the non-dynamic set (no change), these differentially methylated DMVs are enriched for marker genes as identified by this study, the modification H3K27me3, and for CGI hypermethylation within the Xecto lineage. They are also ~4.3 times larger than constitutively hypomethylated DMVs (mean span = 12.2 kb for dynamically methylated, 2.8 kb for no change). Enrichment is calculated as an odds ratio (OR) or fold change (FC) compared to no change. DMV methylation status across these KOs is available as Supplementary Table 8. n = 248 DMVs in cluster 1 vs n = 6,888 for no change. Right: DNA methylation violin plots of the 248 DMVs that gain CpG methylation within the E6.5 epiblast of our PRC KOs. “DMV” measures methylation of all non-CpG island CpGs within DMV boundaries, while “CGI” measures those for all CGI positioned within DMV boundaries (n = 529). “CGI (Xecto hyper)” measures the methylation for the subset of DMV-associated CGI that are specifically de novo methylated in WT Xecto (n = 191). In the epiblast, DMV methylation is highest for Rnf2 KO and lower for the same regions in Eed KO. In contrast, Kdm2b KO shows substantial heterogeneity, with >55% of DMVs showing lower methylation compared to the Eed KO. The DMVs that gain DNA methylation in the epiblast of PRC KOs are generally naturally de novo methylated in the Xecto (including methylation of CGIs). Here, the CGIs in the Eed KO pose an exception as they show a specific loss of methylation.
b. Heatmaps showing the WT expression status of 303 genes contained within differentially methylated DMVs. In PRC component KOs, the loss of bivalence may prime genes for induction. However, there is no clear correlation between the genes located within differentially methylated DMVs and the lineages that are ultimately overproduced. While the exact relationship remains unclear, our DNA methylation analysis indicates that aspects of the PRC mutant phenotype begin to manifest within the pre-gastrula embryo, leading to similar epigenetic changes within the promoters of master regulators associated with all three germ layers. Left: Mean DMV methylation for each KO and WT as calculated in a (with CGI CpGs excluded). Middle: Row-normalized expression of DMV-associated genes across our 42 WT states. Right: Fraction of KO cell states where a given gene is recurrently up- or downregulated. DMVs (rows) are clustered by methylation status and cell states (columns) by DMV-associated gene expression. Top: Identity and presence of cell states in E8.5 KOs. States are designated as early, middle or late (most prevalent in WT at E6.5 to E7.0, E7.5, or E8.0 to E8.5, respectively). The cumulative number of DMV-associated genes expressed within each state in WT is also provided.
c. The percentage of DMV-associated genes that are expressed in our 42 WT states collapsed into early, middle or late based upon when states emerge (E6.5–7.0, E7.5, or E8.0-E8.5). In general, differentially methylated DMV-associated genes are normally expressed in the middle or late periods of our gastrulation time series.