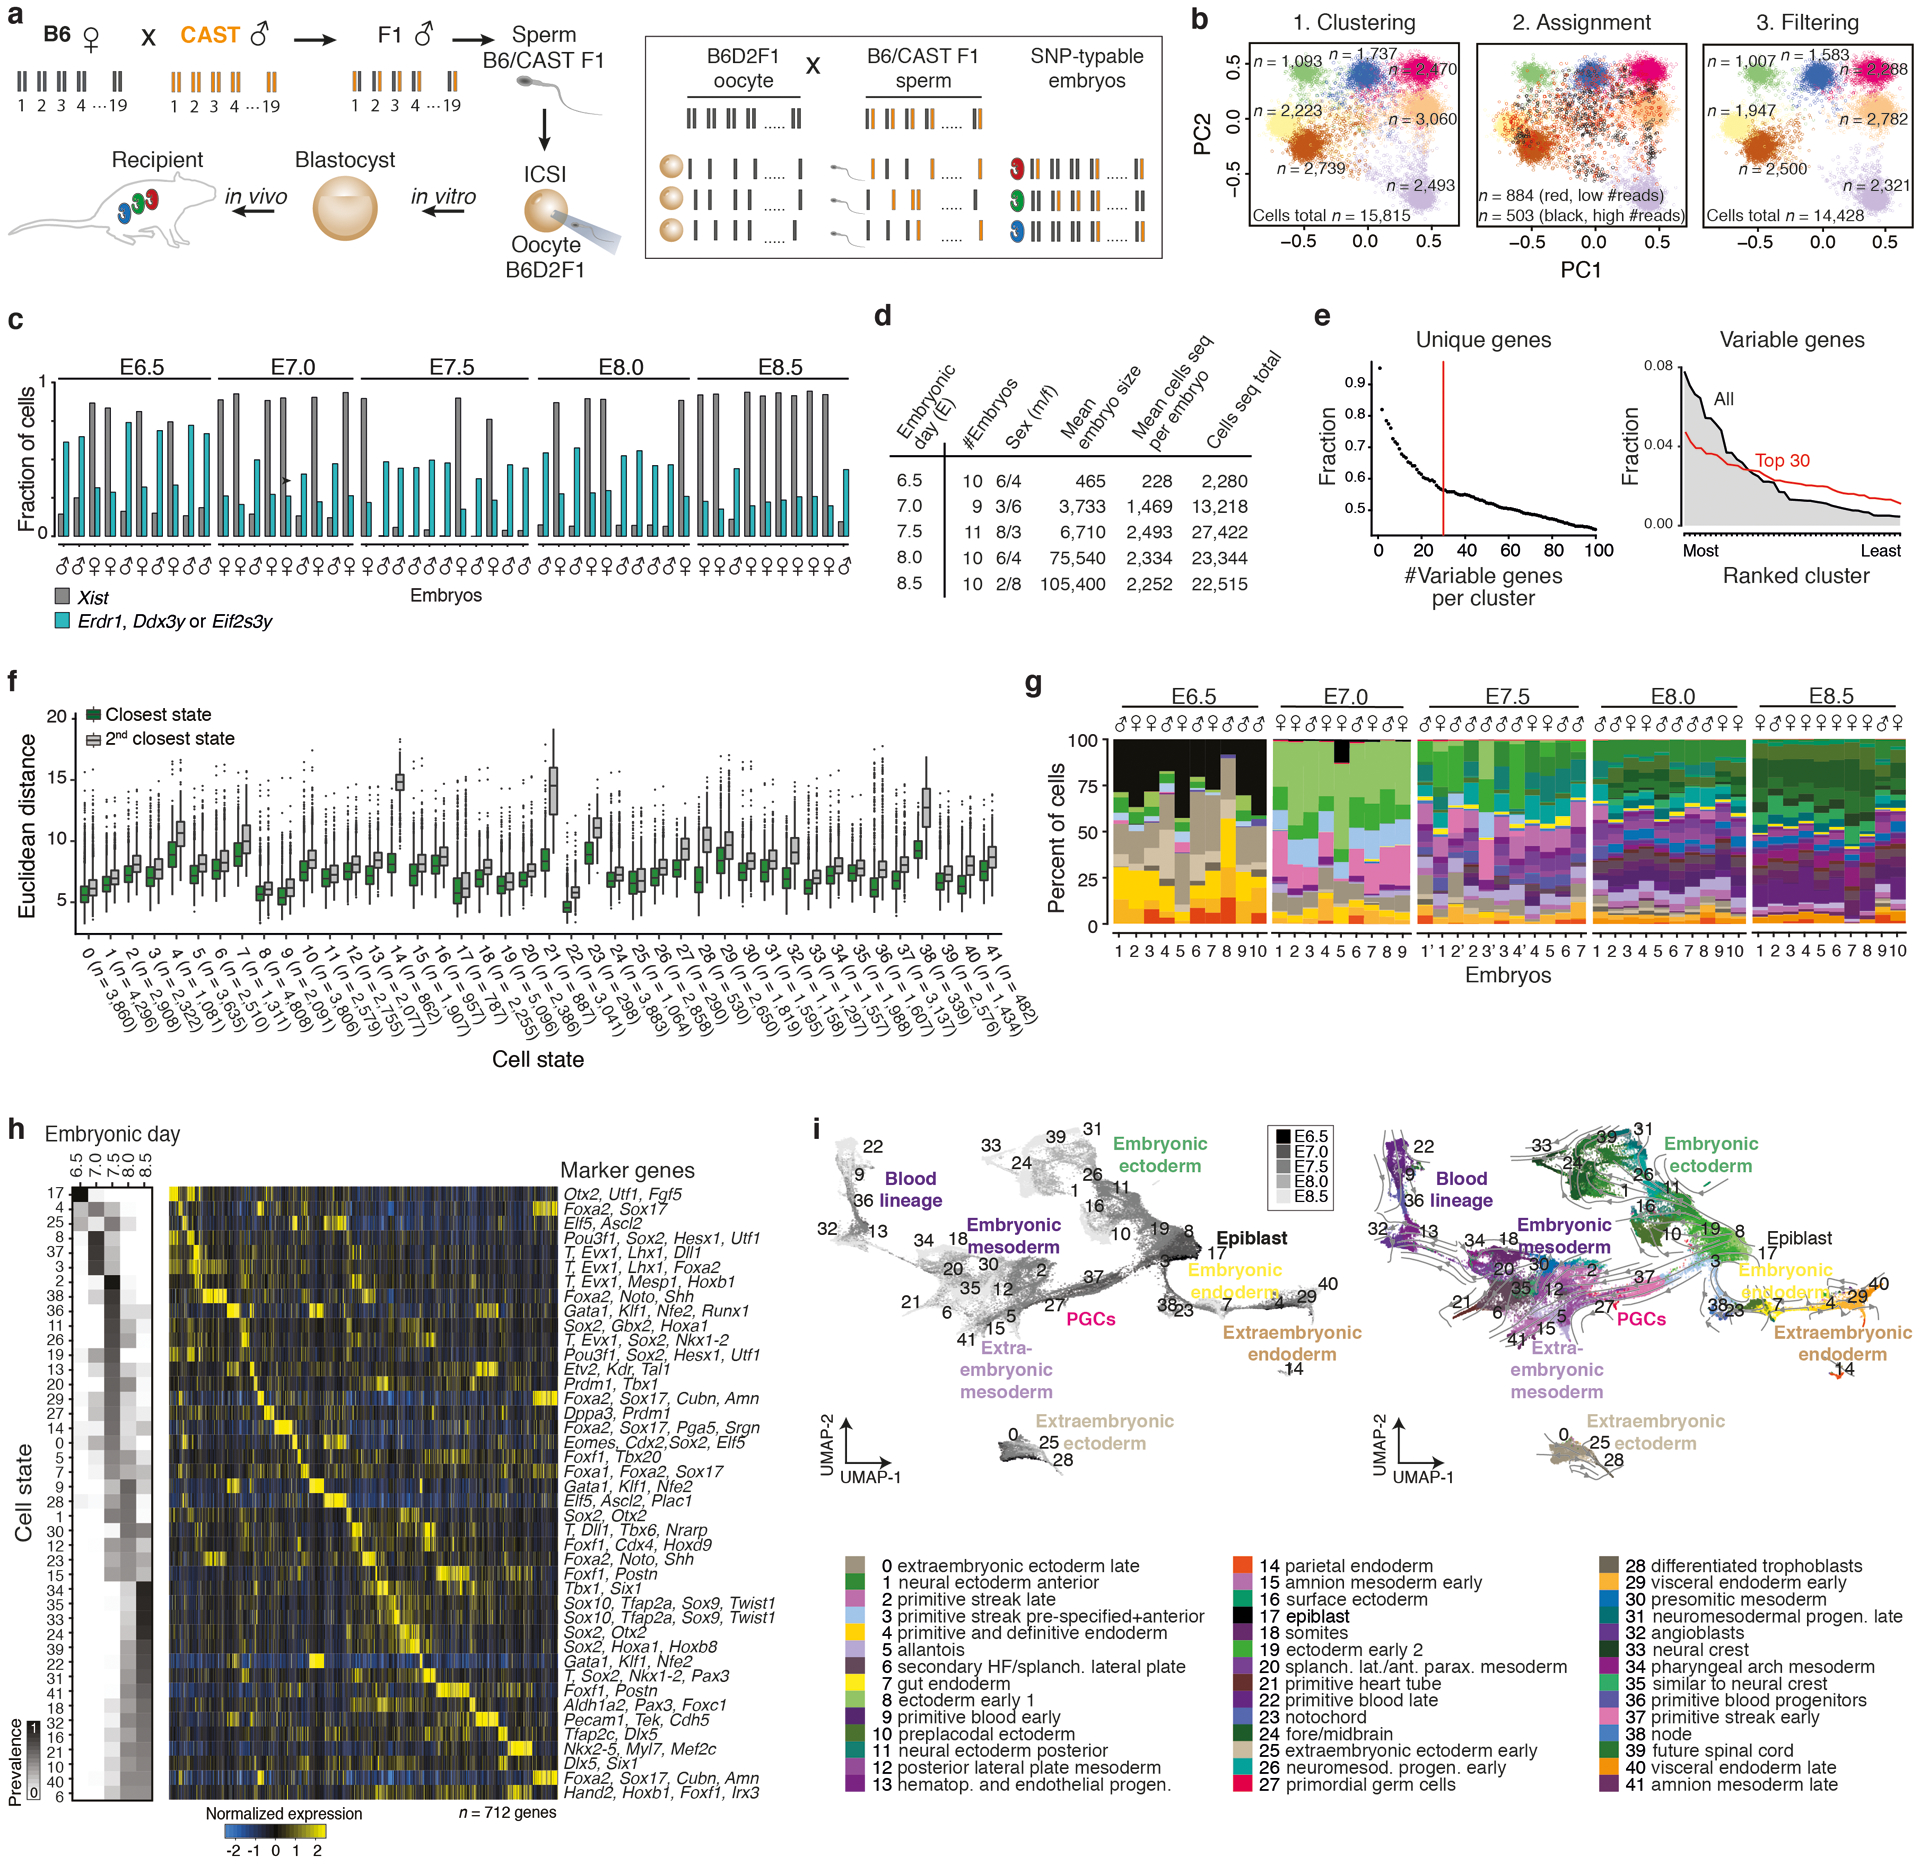
Extended Data Figure 1. SNP-based genotyping and assignment of single cells into 42 discrete cell states.

a. Single nucleotide polymorphism (SNP) based cell-to-embryo assignment strategy. Embryos were generated by intracytoplasmic sperm injection (ICSI) using sperm from hybrid males (C57BL6/J × CAST/EiJ) to confer a randomly inherited CAST/EiJ haplotype. Siblings (individually colored embryos) are pooled prior to single-cell RNA sequencing (scRNA-seq) and computationally deconvoluted based on their embryo-specific SNP profiles. Briefly, the ratios of CAST-specific SNPs (orange) are scored per chromosome to cluster cells into distinct embryos. We use B6D2F1 (C57BL6/J × DBA) oocytes, whose genotypes differ by only ~4.5M SNPs compared to ~17.7M for CAST/EiJ57.
b. SNP-based deconvolution of seven pooled E7.5 wild-type (WT) embryos. Left: Principal Component Analysis (PCA) projection of autosomal CAST SNP ratios for all sequenced cells with ≥1,000 covered SNPs. Cells are colored by cluster assignment, indicating individual genotypes (embryos). Center: Iterative sampling of 20% covered SNPs per cell flags cells with unstable embryo assignments. Flagged cells with lower than median SNP counts represent low quality cells, while those with higher counts collect between clusters and likely reflect doublets. Cells with unstable genotype assignments were excluded from further analysis. Right: PCA projection of all cells that were stably assigned to an embryo.
c. Per embryo fraction of cells with Xist (grey) and three Y-linked gene transcripts (Erdr1, Ddx3y or Eif2s3y, blue) used for sex-typing. For cell numbers, see Supplementary Tables 1 and 2.
d. Summary statistics of profiled WT embryos from E6.5–8.5 (n = 50 total).
e. Left: Fraction of variable genes that are uniquely assigned to a single state when taking the top N-most differentially expressed genes per cluster. We selected the top 30 most unique genes per cluster (n = 712 genes) because it maximizes the information per cluster under the constraint that the number of marker genes be as similar across states as possible. Right: Ranked order distribution for the fraction of all variable or of the top 30 marker genes expressed in each of our 42 states. Our top 30 marker criterion reduces the range of variable genes that are used to assign single cells to each state.
f. Single cell Euclidean distances to their closest (green) or second closest (grey) state. The distribution of differences between first and second closest cluster are all significant (P < 2×10⁻¹⁶, Wilcoxon test, two tailed, paired test).
g. Per embryo barplots show percent of cells (y-axis) assigned to each cell state (n = 42 states, 50 embryos total). For absolute cell counts, see Supplementary Tables 1 and 5.
h. Left: Heatmap of cell state prevalence across profiled embryonic stages. The median state proportions are calculated across embryos for each time point, then row normalized across time points to show their dynamics. Right: Expression heatmap of our 712 marker genes, with key markers for each state highlighted (see Supplementary Text). Mean state expression for each marker gene is normalized over the column and arranged by maximal expression value across states.
i. Left: Uniform Manifold Approximation and Projection (UMAP) of WT cells (n = 88,779) colored by time point from dark to light gray. Right: WT UMAP overlaid with RNA velocity54 information as an indicator of transcriptome dynamics between different cell states.
