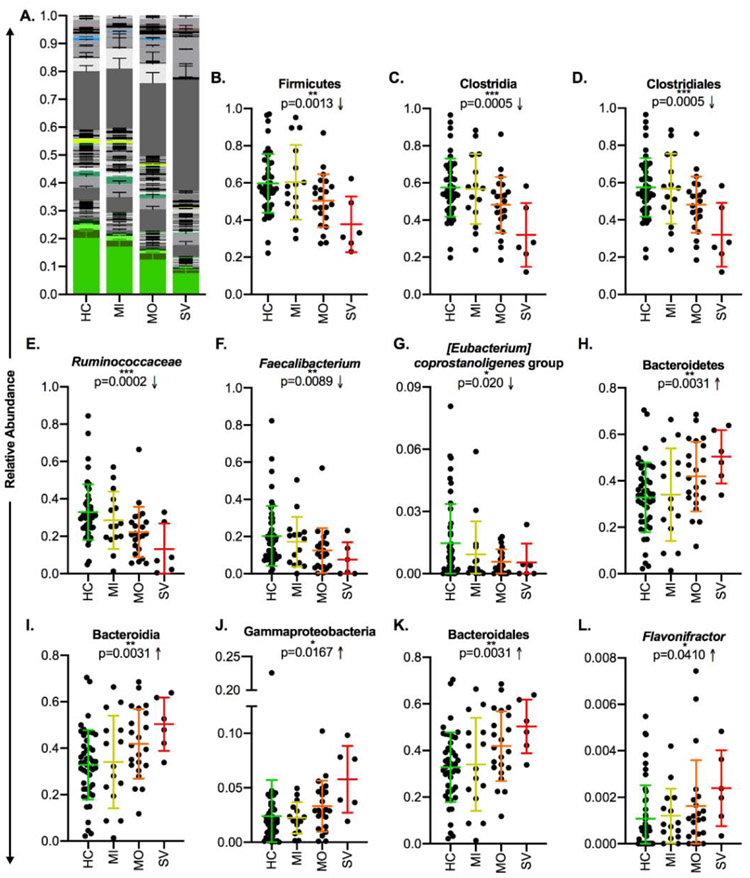
Figure 6: Taxonomic Differences in MDD Subjects Track Significantly with Symptom Severity.
A) Stacked bar plot indicating the average relative abundance of genera within the control subjects and MDD subjects with mild, moderate, or severe symptoms according to PROMIS depression scores, with genera that discriminated the control and MDD groups identified by LEfSe highlighted in color. B-L) Relative abundances of discriminant taxa in the control, MDD-mild symptoms, MDD-moderate symptoms, and MDD-severe symptoms groups. In A, stacking is done by phylogeny, so all genera are grouped by their higher taxonomic ranks. Error bars indicate standard error of the mean. In B-L, central lines indicate the group mean and error bars indicate standard deviation, p-values are from the ANOVA post-test for linear trend of column means, and arrows indicate the direction of the trend. Abbreviations: MDD = Major Depressive Disorder, LEfSe = Linear Discriminant Analysis Effect Size, HC = Healthy Control, MI = Mild, MO = Moderate, SV = Severe. LEfSe is a biomarker discovery tool used to identify features (taxa, in this case) from high-dimensional genomic data that characterize differences between two or more biological conditions.

