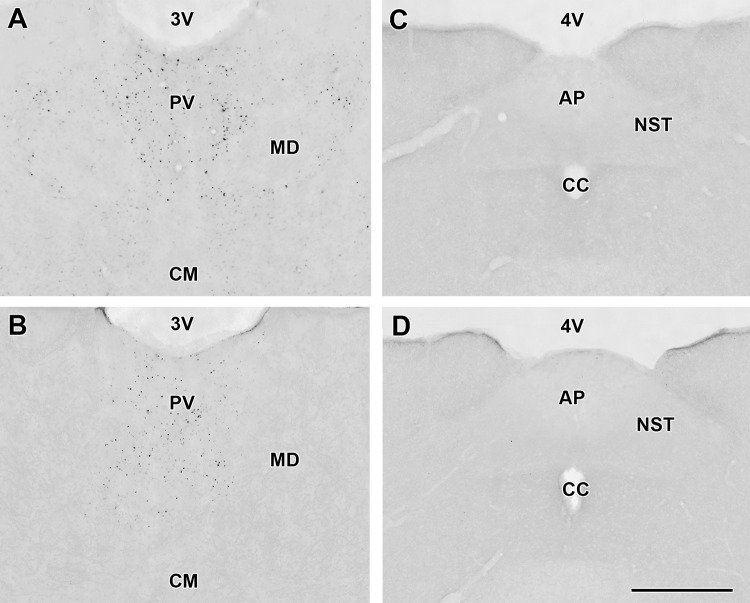
Fig. 3.
Some examples on the activation pattern of c-Fos in response to DON treatment. a c-Fos positive cells are shown in the paraventricular thalamic nucleus (PV) following DON administration. The abundant black dots represent the c-Fos positive cells. b The PV of a control (saline injected) animal contains less c-Fos positive cells than the DON injected animal, however, the density of labelled cells is still considerably high. In contrast to the PV, the area postrema (AP) and the nucleus of the solitary tract (NTS) do not express c-Fos either following DON (c), or following saline injection (d). The scale bar is 500 µm. cc central canal, CM central median nucleus, MD mediodorsal thalamic nucleus, 3 V third ventricle, 4 V fourth ventricle

