
Figure 3.
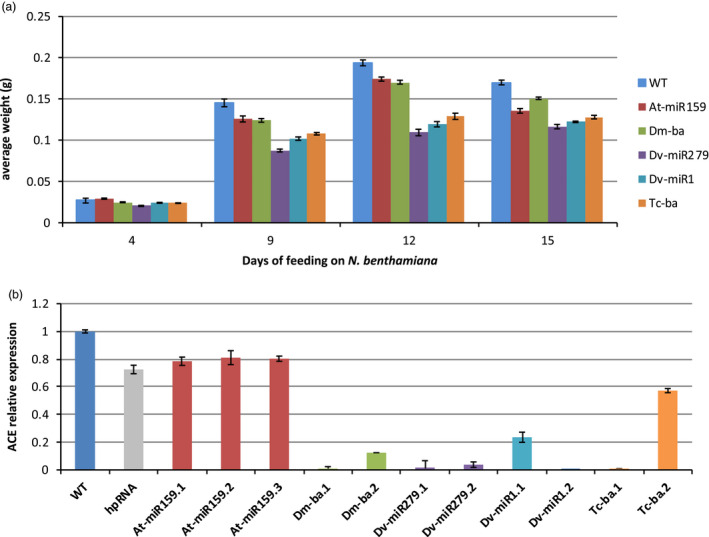
Helicoverpa armigera feeding assay on N. benthamiana expressing ACE plin‐amiRs. (a) Representation of the average larval weight (in grams), y‐axis, stable T2 N. benthamiana events used in the bioassay at 4, 9, 12, 15 and 17 days of feeding, x‐axis. (b) RT‐qPCR ACE2 transcripts level in H. armigera fed on plin‐amiR transformed lines. Error bars indicate standard error of the mean from three biological replicates.