
Figure 3.
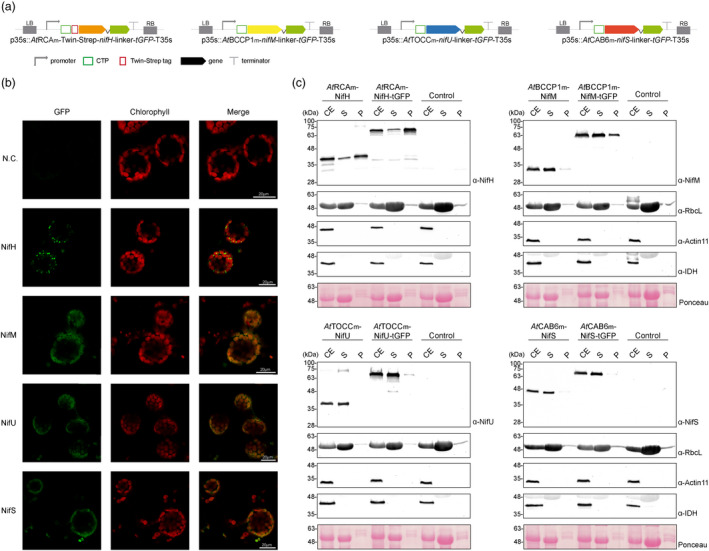
Localization of stroma‐targeted Nif proteins. (a) Schematic representation of the constructs used in N. benthamiana‐transient expression assays leading to Nif localization. (b) Confocal microscopy images of Nif proteins fused to tGFP. N.C. corresponds to ‘negative control’, a non‐agroinfiltrated leaf. The three columns show the individual signals for tGFP (green, on the left) and chlorophyll autofluorescence (red, in the centre). On the right, overlap of both signals (merge). (c) Chloroplast purification assays. Total proteins extract prior to chloroplast purification (CE). Intact chloroplasts were isolated and then broken to separate the soluble (S) and membrane‐associated (P) fractions. Control refers to N. benthamiana plants agroinfiltrated with agrobacterium transformed with an empty vector. Proteins were resolved by SDS‐PAGE and detected by Western blot. Expected sizes are Twin‐Strep NifH: 35.3 kDa, NifM: 32.3 kDa, NifU: 34.4 kDa, NifS: 44.3 kDa (27 kDa more in the case of tGFP fusions), RbcL: 52.7 kDa, Actin‐11: 41.6 kDa and IDH: 39 kDa. Note that the IDH blot was re‐probed after striping anti‐RuBisco and some signal remains (upper band).