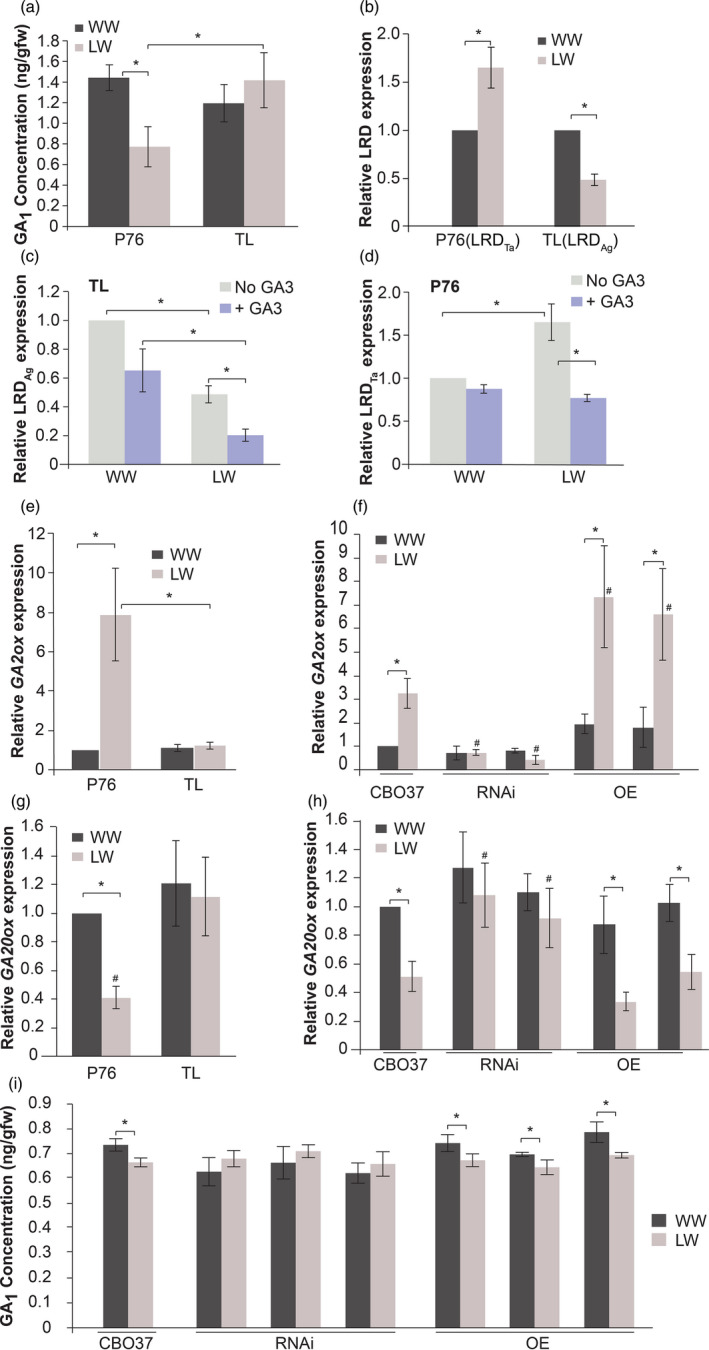
Figure 4.

Water stress causes GA level reduction in P76 but not in TL by regulating GA‐related genes. (a) GA1 levels in P76 and TL seedling roots (6 days) under WW and LW conditions (mean ± SD n = 30). (b–d) Allele‐specific expression of LRD in 6‐day‐old seedling roots. LRD Ta denotes the wheat allele and LRDAg denotes the Agropyron allele. (b) Expression of LRD under LW for each genotype is relative to respective WW condition (mean ± SD from three replicates). (c, d) LRD levels in (c) TL (LRDAg ) and (d) P76 (LRD Ta) roots (6 days) under WW and LW conditions, with and without GA3 treatment. Transcript abundance was measured relative to WW, non‐GA3 treated sample within each genotype (mean ± SD n = 3). (e–h) Transcript abundance of GA metabolic genes in 6‐day‐old roots of different genotypes. (e, f) GA catabolic; GA2ox, and (g, h) GA biosynthesis; GA20ox gene, in 6‐day‐old roots under WW and LW conditions (mean ± SD; n = 3). Transcript abundance (e, g) in P76/TL was measured relative to WW P76 sample, and (f, h) in CBO37/RNAi/OE was measured relative to WW CBO37 roots. ‘#’ indicates significant difference between genotypes within a water treatment (p < .05). (i) GA1 levels in CBO37, RNAi and OE in 6‐day‐old roots under WW and LW conditions (mean ± SD; n = 30). ‘*’represents significant difference (P < 0.05) using two‐tailed Student’s t‐test.
