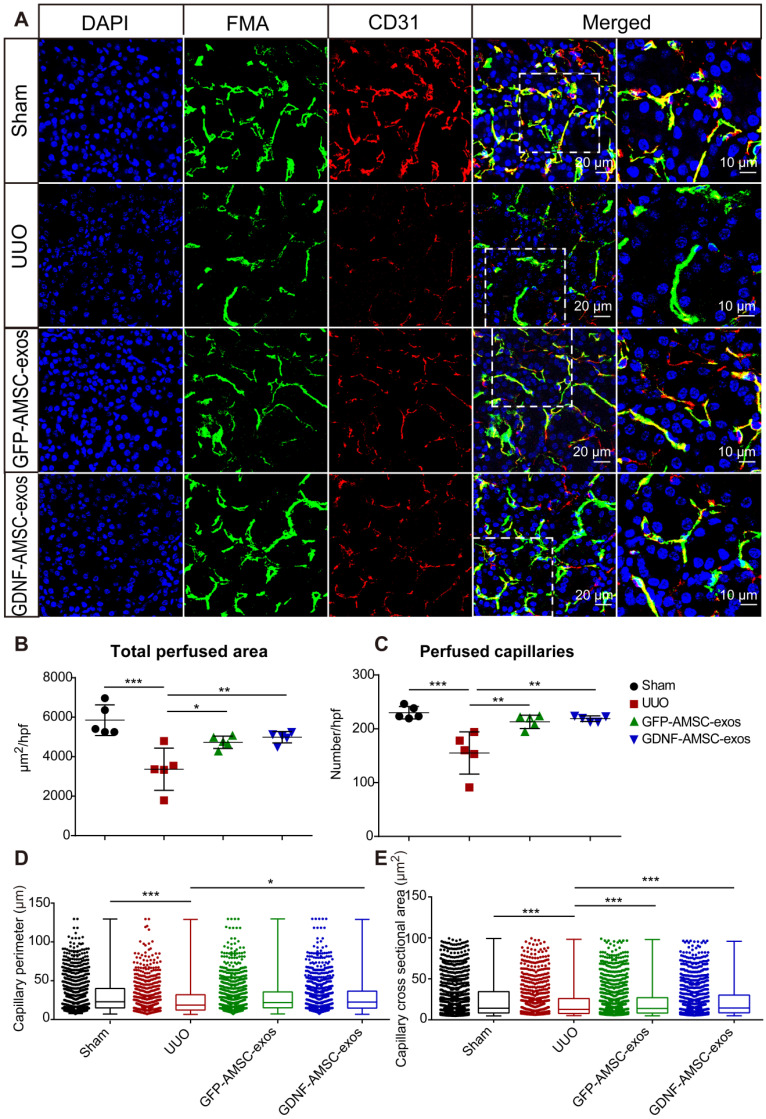
Figure 3.
High-throughput software-based analysis of fluorescence microangiography (FMA). (A) FMA after unilateral ureteral obstruction (UUO) surgery in mice treated with exosomes isolated from GFP-expressing adipose mesenchymal stem cells (GFP-AMSC-exos), exosomes derived from GDNF-modified human adipose mesenchymal stem cells (GDNF-AMSC-exos), or phosphate-buffered saline (PBS), together with CD31 immunostaining, demonstrated capillary rarefaction in response to the severity of the injury. Capillaries with red CD31+ endothelial cells surrounding the green FMA solution; blue: DAPI. The scale bars represent 20 µm and 10 µm as noted. (B and C) Quantitative analysis of the total cortical cross-sectional capillary area and capillary number per high-power field. (D and E) Perimeter (mean ± SEMs, sham group: 30.76 ± 0.64 µm2; UUO group: 26.45 ± 0.72 µm2; GFP-AMSC-exos group: 28.94 ± 0.63 µm2; GDNF-AMSC-exos group: 29.85 ± 0.63 µm2) and cortical individual capillary cross-sectional area (mean ± SEMs, sham group: 25.47 ± 0.68 µm2; UUO group: 21.69 ± 0.75 µm2; GFP-AMSC-exos group: 22.27 ± 0.63 µm2; GDNF-AMSC-exos group: 23.13 ± 0.63 µm2) The data represent n = 5 mice per group. The mean ± SEMs are shown in B and C; box and whiskers indicating the 10th-90th percentiles are shown in D and E. *P < 0.05; **P < 0.01; ***P < 0.001.

