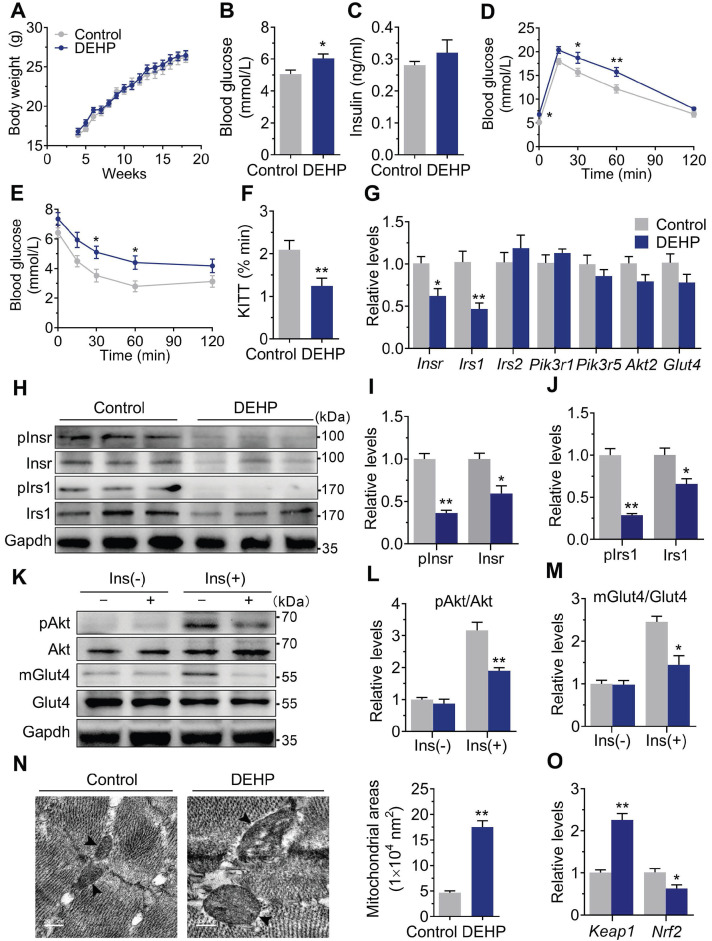
Figure 1.
Exposure to DEHP induced IR. A. The weekly body weight (n = 10 mice per group). B. The fasting blood glucose (n = 10 mice per group). C. The fasting serum insulin (n = 10 mice per group). D. The dynamics of blood glucose curve during intraperitoneal glucose tolerance test (IPGTT, 2 g/kg bw, n = 5 mice per group). The quantification of total area under the curve (AUC) for IPGTT were shown in Figure S1C. E. The insulin sensitivity assessed by insulin tolerance test (ITT, 0.75 U/kg, n = 5 mice per group). F. The calculated constant rate for glucose disappearance (KITT) from 0 to 30 min of ITT. G. The mRNA expression of genes related to insulin signaling pathway in SkM (n = 4 mice per group). Gapdh was used as the loading control. H-J. The protein expression and phosphorylation of Insr and Irs1 in SkM (n = 3 mice per group). Gapdh was used as the loading control. K-M. The representative western blot images (K) and quantification (L-M) of insulin-stimulated phosphorylation of Akt (pAkt, ser473) and Glut4 translocation in SkM (n = 3 mice per group). mGlut4: Glut4 in plasma membrane, Glut4: Glut4 in total homogenate. All quantitative results were normalized by Gapdh. N. The representative TEM images and quantification of mitochondrial areas in SkM. Mitochondria were indicated by black arrowheads. The average mitochondrial area was determined by manually circling 15 mitochondria within the SkM per mice (n = 3 mice per group, Scale bar = 200nm). O. The mRNA expression of Keap1 and Nrf2 in SkM (n = 4 mice per group). Expression level were normalized to Gapdh. All data were presented as the mean ± SEM. *P < 0.05 control mice vs. DEHP-exposed mice, **P < 0.01 control mice vs. DEHP-exposed mice.

