Figure 5.
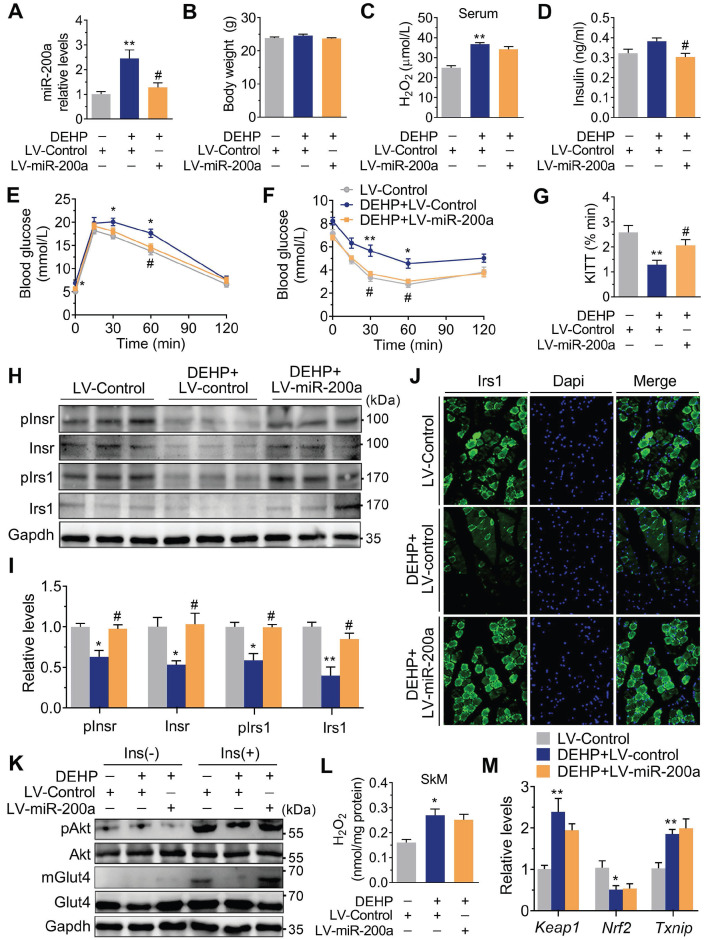
Inhibition of miR-200a improved DEHP-induced IR. DEHP-exposed mice were infected with control lentivirus (LV-Control) or anti-miR-200a lentivirus (LV-miR-200a) (n = 6 mice per group). A. The expression of miR-200a in SkM. U6 was used to normalized miR-200a expression (n = 3 mice per group). B. The body weight (n = 6 mice per group). C. The serum level of H2O2 (n = 6 mice per group). D. The fasting serum insulin (n = 6 per group). E. The IPGTT (n = 5 mice per group). The calculated AUC of the IPGTT were shown in Figure S4B. F. The ITT (n = 5 mice per group). G. The KITT obtained in the ITT (0-30min). H-I. The expression and phosphorylation of Insr and Irs1 in SkM. Quantitative results (I) were normalized by Gapdh (n = 3 mice per group). J. The immunofluorescent detection of Irs1 in SkM (400×, n = 3 mice per group). Nucleus was stained with Dapi (blue) and Irs1 was probed with a primary anti-Irs1 antibody (green). K. The insulin stimulated pAkt and mGlut4 in SkM. Quantitative results were normalized by Gapdh and shown in Figure S4C (n = 3 mice per group). L. The H2O2 content normalized to protein content in SkM (n = 3 mice per group). M. The mRNA expression of genes related to oxidative stress. Gapdh was used as the loading control (n = 3 mice per group). All data were presented as the mean ± SEM. *P < 0.05 DEHP-exposed mice infected with LV-Control vs. control mice infected with LV-Control, **P < 0.01 DEHP-exposed mice infected with LV-Control vs. control mice infected with LV-Control. #P < 0.05 DEHP-exposed mice infected with LV-Control vs. DEHP-exposed mice infected with LV-miR-200a.

