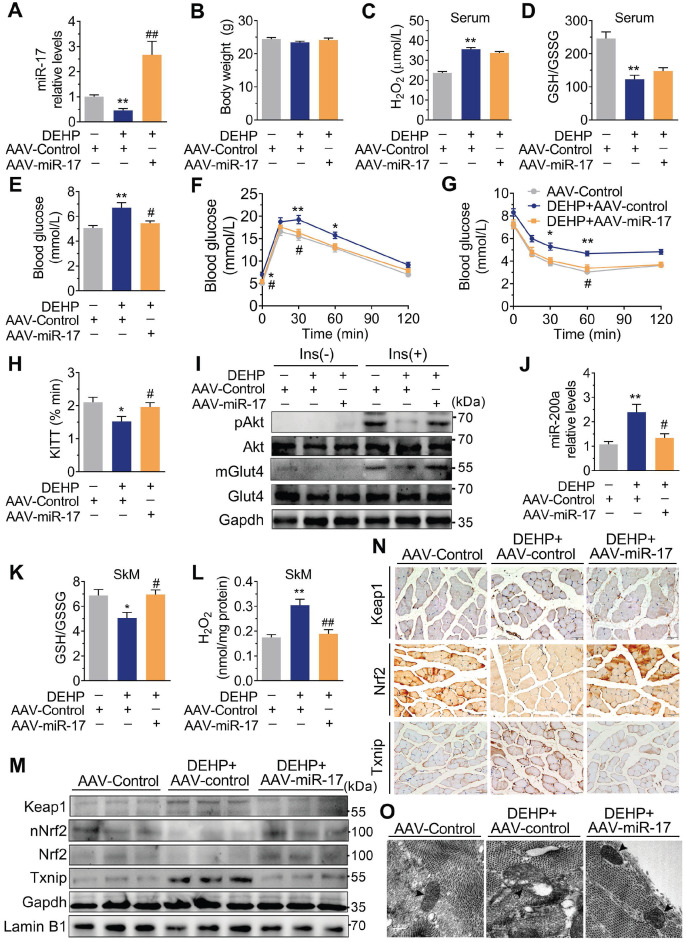
Figure 7.
Overexpression of miR-17 in SkM was resistant to DEHP-induced oxidative stress and IR. The miR-17 was overexpressed in SkM of DEHP-exposed mice using recombinant adeno-associated virus 9 (AAV9) delivery method (n = 6 mice per group). A. The expression of miR-17 in SkM. U6 was used to normalized miR-17 expression (n = 3 mice per group). B. The Body weight (n = 6 mice per group). C. The serum level of H2O2 (n = 5 mice per group). D. The GSH/GSSG ratio calculated by the serum levels of GSH (Figure S9B) and GSSG (Figure S9C) (n = 5 mice per group). E. The fasting blood glucose level (n = 6 mice per group). F. The IPGTT (n = 5 mice per group). The calculated AUC of the IPGTT were shown in Figure S9D. G. The ITT (n = 5 mice per group). H. The KITT obtained in the ITT (0-30min). I. The representative western blot images of pAkt and mGlut4 in SkM (n = 3 mice per group). Gapdh was used as the loading control and the quantification data were shown in Figure S9E-F. J. The expression of miR-200a in SkM. U6 was used to normalized miR-200a expression (n = 3 mice per group). K. The GSH/GSSG ratio in SkM (n = 3 mice per group). Levels of GSH and GSSG were shown in Figure S9G-H, respectively. L. The H2O2 content in SkM (n = 3 mice per group). M. The representative western blot images of genes related to oxidative stress (n = 3 mice per group). The total protein was normalized by Gapdh and the protein expression of Nrf2 in nuclear were normalized by Lamin B1. The quantification data were shown in Figure S9I. N. The representative images of immunohistochemical staining of genes related to oxidative stress. (Scale bar = 50 µm). O. The representative TEM images of SkM (Scale bar = 200nm, n = 3 mice per group). Mitochondria were indicated by black arrowheads. Calculation of mitochondrial area was shown in the Figure S9J. All data were presented as the mean ± SEM. *P < 0.05 control mice infected with AAV-Control vs. DEHP-exposed mice infected with AAV-Control, **P < 0.01 control mice infected with AAV-Control vs. DEHP-exposed mice infected with AAV-Control. #P < 0.05 DEHP-exposed mice infected with AAV-Control vs. DEHP-exposed mice infected with AAV-miR-17, ##P < 0.01 DEHP-exposed mice infected with AAV-Control vs. DEHP-exposed mice infected with AAV-miR-17.

