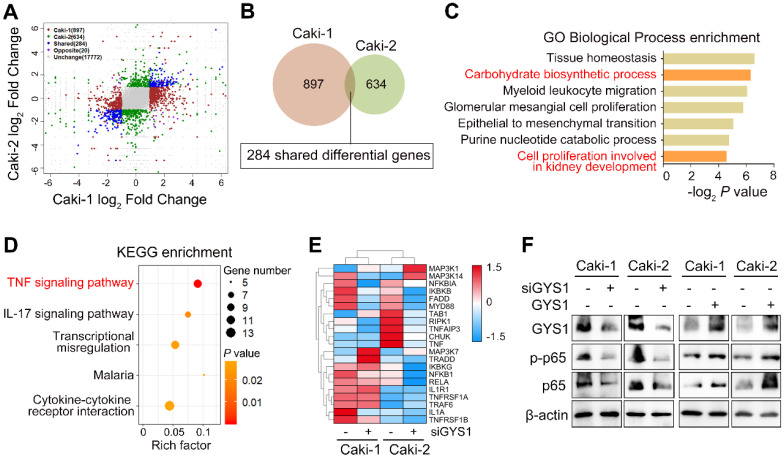
Figure 4.
Pathway-based analysis of GYS1 depletion by RNA sequencing. (A) Clustering of transcriptome sequencing in Caki-1 and Caki-2 cells with GYS1 siRNA transfection. Significance was set based on P < 0.05 and absolute fold-change > 2. (B) Venn diagraph filtered 284 shared differential genes in Caki-1 and Caki-2 cells with GYS1 silencing. (C) Gene Ontology (GO) enrichment analysis indicated the biological processes influenced by the filtered genes. (D) KEGG enrichment of filtered genes indicated signaling transduction pathway alterations. (E) Heatmap was generated based on BIOCARTA NF-κB pathway clustering. (F) Western blot indicated the expression of p-p65 and p65 regulated by GYS1.

