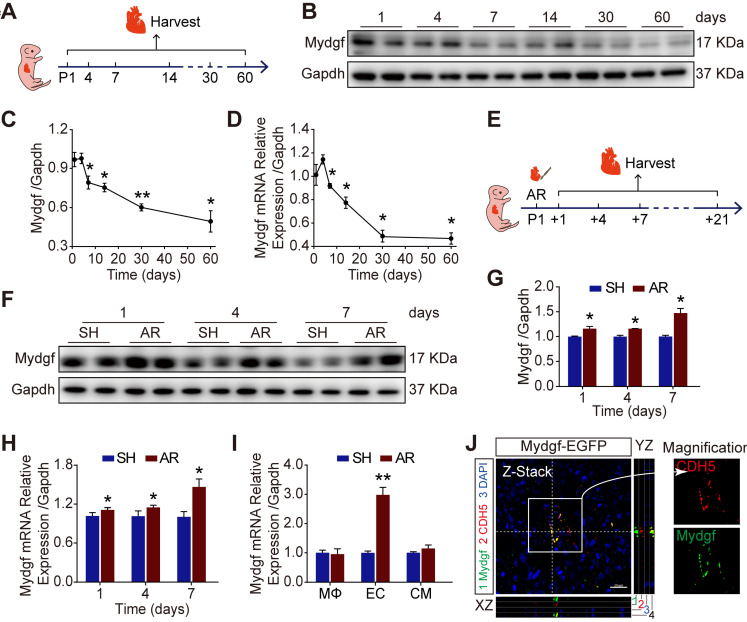
Figure 1.
Mydgf is induced during neonatal heart regeneration. (A) Schematic diagram showed the experimental design for B-D. (B-C) Western blot analysis of Mydgf expression in wild-type (WT) mouse heart at different ages. Statistical analysis revealed that the expression of Mydgf decreased with age (n = 3 per group). (D) qRT-PCR analysis of Mydgf expression in WT mouse heart at different ages. Statistical analysis revealed that the expression of Mydgf decreased with age (n = 3 per group). *P < 0.05 and **P < 0.01 compared to postnatal day 1 (P1) by one-way ANOVA with Bonferroni's multiple comparisons test (C, D). (E) Schematic diagram showed the experimental design for F-M. (F-G) Western blot analysis of Mydgf in WT mouse hearts harvested at 1, 4, 7 days after apical resection (AR). Statistical analysis revealed that the expression of Mydgf was upregulated post neonatal heart injury (n = 3 per group). (H) qRT-PCR analysis of Mydgf in WT mouse hearts harvested at 1, 4, 7 days after AR. Statistical analysis revealed that the expression of Mydgf was upregulated post neonatal heart injury (n = 3 per group). (I) qRT-PCR analysis of Mydgf expression in three cell populations sorted by flow cytometry at 1 day after AR. Statistical analysis revealed that the expression of Mydgf was upregulated in endothelial cells post neonatal heart injury (n = 3 per group). *P < 0.05 and **P < 0.01 compared to SH at corresponding time-point by Student's t-test (G, H and I). (J) Mydgf and CDH5 (endothelial cell marker) were co-located by staining for EGFP (green), CDH5 (red), and nuclei (blue) at 7 days after AR in Mydgf-EGFP mice. Scale bars, 20 µm. Values were presented as the mean ± S.E.M.

