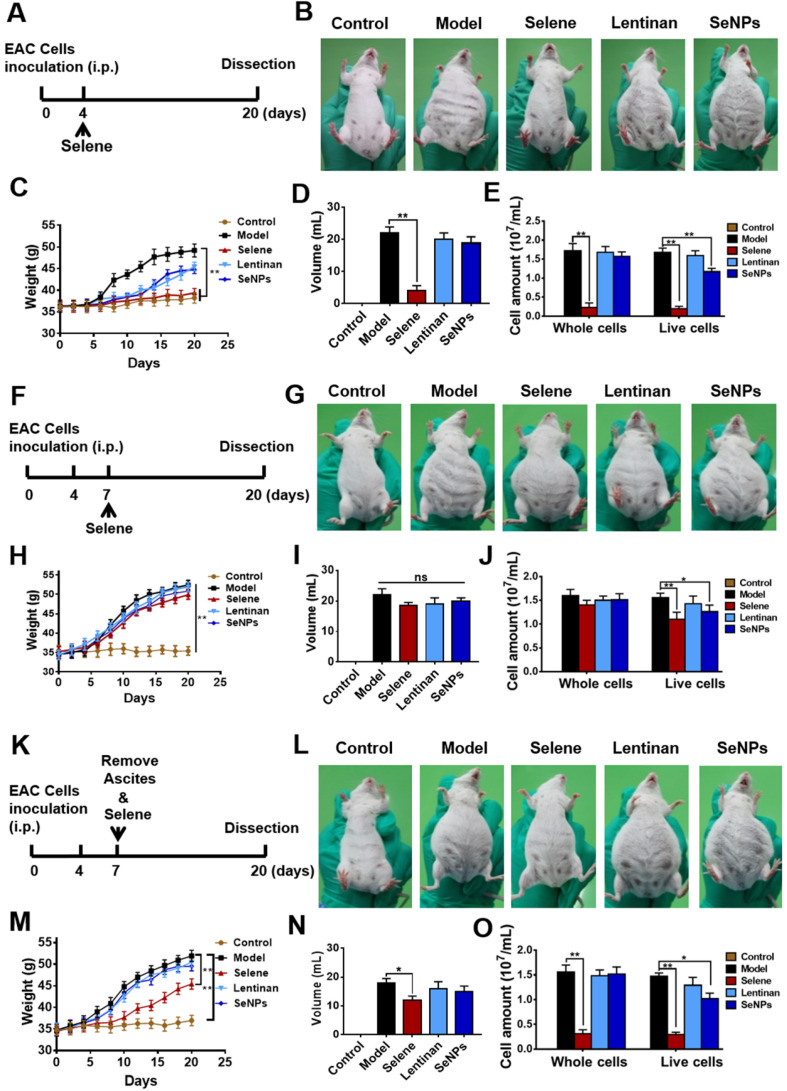
Figure 2.
Selene inhibited ascites induced by EAC in vivo. A. Schematic diagram of model establishment and drug administration. The mice were treated with Selene, lentinan, or SeNPs from the fourth day after the modeling, when ascites began to appear. B. Representative images of mice in the different groups. C-E. Body weight, volume of ascites, and cancer cell numbers in ascites of each group. F. Schematic diagram of model establishment and drug administration. The mice were treated with Selene from the seventh day after the modeling, when a large amount of ascites appeared. G. Representative images of mice in different groups. H-J. Changes in body weight, volume of ascites, and cancer cell number in ascites of different groups. K. Schematic diagram of model establishment and drug administration. The mice were treated with Selene after the ascites were removed from the seventh day after the modeling. L. Representative images of mice in the different groups. M-O. Changes in body weight, volume of ascites, and cancer cell numbers in ascites of the different groups. Results are shown as means ± SD (*P < 0.05, **P < 0.01).

