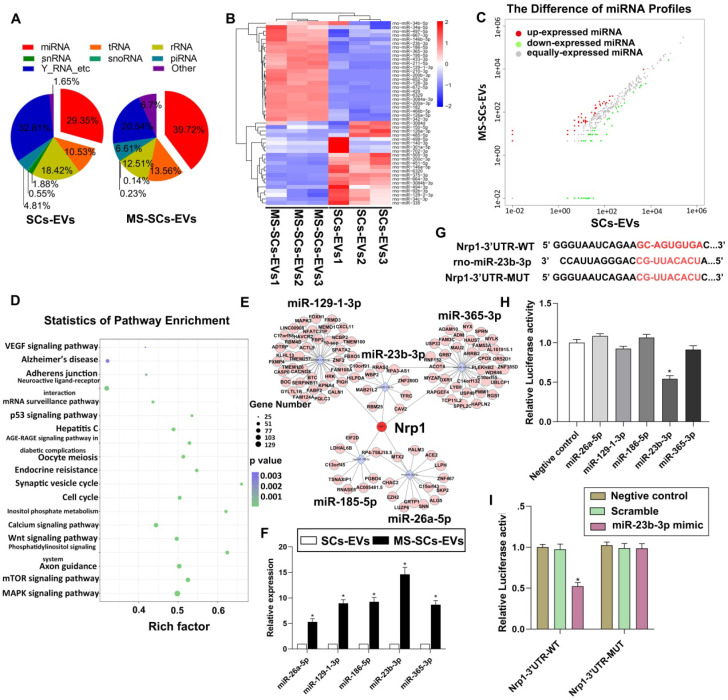
Figure 5.
miRNA expression profile of MS-SCs-EVs is significantly altered compared with SCs-EVs. (A) Percentage of small RNA categories in all reads mapped to noncoding RNA databases. (B) Heatmap diagram of differential miRNA expression between MS-SCs-EVs and SCs-EVs. Gene expression data were obtained using next-generation sequencing on the Illumina HiSeq 2500 platform. Expression values shown are mean centered. Red, increased expression; blue, decreased expression, and white, mean value. (C) Differentially expressed miRNAs between MS-SCs-EVs and SCs-EVs. Red, increased expression; green, decreased expression; gray, no difference. P < 0.05 and fold change>2 were considered significant. (D) KEGG pathway enrichment of target genes of the predicted differentially expressed miRNAs. Advanced bubble chart shows enrichment of differentially expressed genes. Y-axis represents pathways, and the x-axis represents rich factor, depicting the ratio of the differentially expressed genes enriched in the pathway and the amount of all genes annotated in this pathway. Size and color of the bubble represent the amount of differentially expressed genes enriched in the pathway and enrichment significance, respectively. (E) Competing RNA network with the most significantly altered miRNAs. (F) Confirmation of the differentially expressed miRNAs in MS-SCs-EVs and SCs-EVs by qRT-PCR (n=6). (G) Predicted miR-23b-3p binding site in the 3'-UTR region of Nrp1. A mutated miR-23b-3p binding site was generated in the complementary site for the seed region of miR-23b-3p. (H) Luciferase assay was performed 48 h after transfection using the dual luciferase. MiR-23b-3p down-regulated the luciferase activity compared with the negative control and other miRNAs. (I) miR-23b-3p mimic down-regulated the luciferase activity controlled by wild-type Nrp1 3'-UTR, while luciferase activity controlled by mutant Nrp1 3'-UTR was not affected. Student's t-test and one-way ANOVA test with Tukey's post hoc test, * P<0.05 for comparison with the SCs-EVs group or the negative control group.

