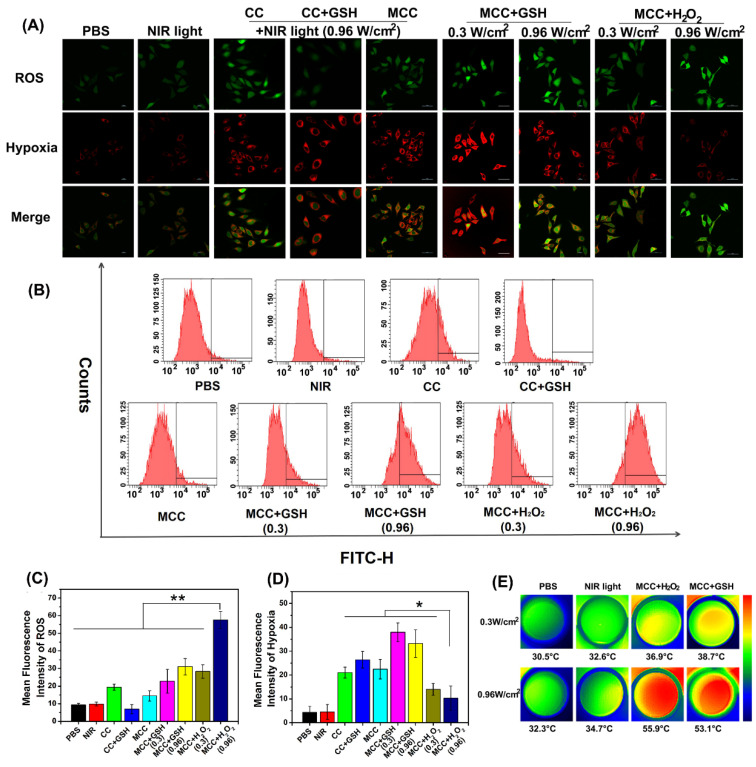
Figure 5.
(A) Confocal images of 4T1 cells treated with CC or MCC in the presence or absence of GSH or H2O2 costained with hypoxia/oxidative stress detection probes under NIR irradiation (808 nm, 0.3 or 0.96 W/cm2). Green fluorescence represents intracellular ROS generation, while red fluorescence represents hypoxia production; (B) The flow cytometric analysis of ROS generation in 4T1 cells cultured with different samples under NIR light irradiation; (C, D) Semi-quantitative of fluorescence intensity from A (n =4). Data are shown as mean ± SD; *p < 0.05; **p < 0.01; (E) Thermal images of 4T1 cells under laser irradiation (808 nm, 0.3 or 0.96 W cm-2, 3 min) after different treatments.

