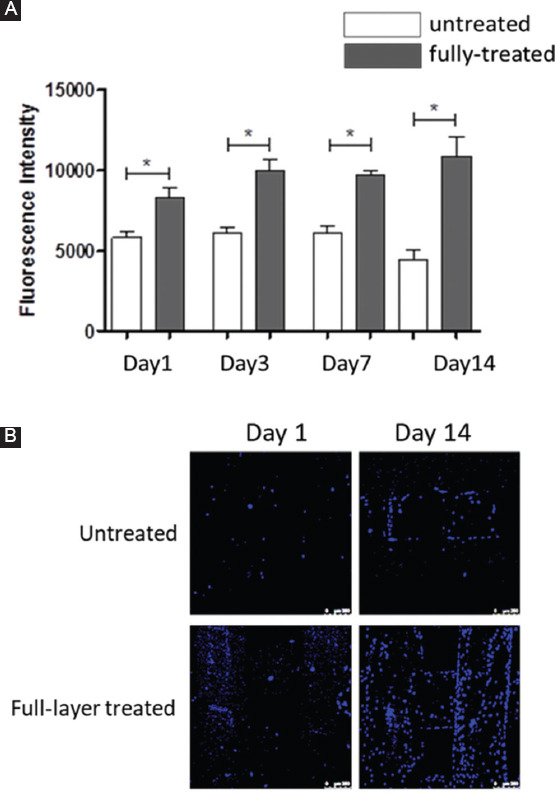
Figure 5.

(A) Temporal variation of fluorescence intensity of cell-seeded PCL scaffolds with and without N2 plasma treatment; (B) confocal microscope images of untreated and full-layer treated of cell-seeded scaffolds, 1 day and 14 days after cell culture. Scale bar 250 μm.
