
Figure 2.
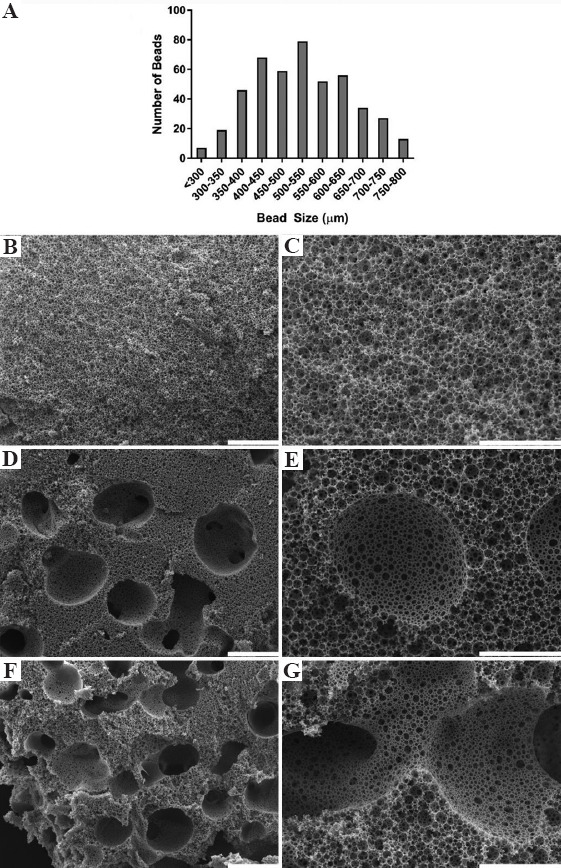
(A) Alginate bead size distribution after sieving. Low (B, D, F, scale bars 500 μm) and high (C, E, G, scale bars 200 μm) magnification scanning electron microscopy images of (B and C) plain polymerized high internal phase emulsions (polyHIPEs), (D and E) 50 wt% alginate bead polyHIPEs, and (F and G) 100 wt% alginate bead polyHIPEs. Large macropores left by alginate beads clearly visible in the 50 and 100 wt% polyHIPEs (D-G), with interconnection between macro pores occurring at the highest wt% (G).