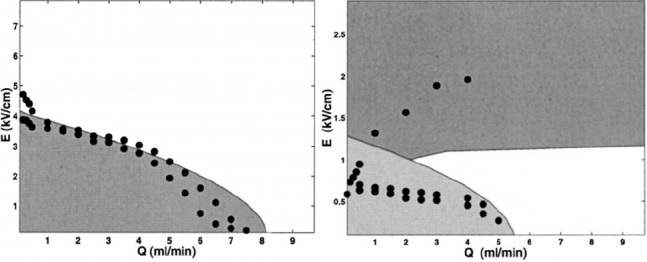
Figure 5.

Operating diagram for (a) glycerol jet (K = 0.1 × 10⁻⁵S/m), ρ = 1.26 × 10³ Kg/m3, μ = 1.87 Pa·s). The shaded region is varicose perturbations, and no whipping instability is present. (b) PEO jet (K = 1.2 × 10⁻² S/m, ρ = 1.2 × 10³ Kg/m3, μ = 2 Pa·s). The lower shaded region is varicose perturbation, and the upper shaded region is whipping instability. The points represent experimental measurements are consistent with theoretical prediction[73]. Adapted by permission from Moses Hohman et al. (2001) under the AIP Publishing LLC.
