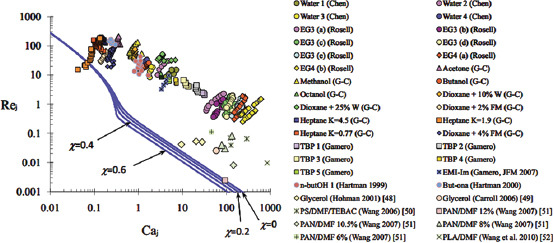
Figure 7.

The continuous curve is theoretical predictions of the transition between absolute and convective instability. Most of the points from experimental values are in the region of convective instability[85]. Adapted by permission from Jose Lopez-Herrera et al. (2010) under the AIP Publishing LLC.
