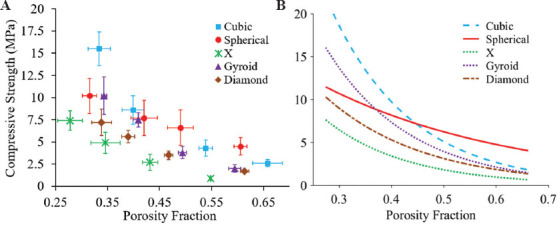
Figure 3.

Compression test results: (A) Compressive strength of borate glass scaffolds with five architectures at different porosity levels. Vertical and horizontal error bars represent the standard deviations of measured compressive strength and porosities, respectively, (B) curve fitting of strength versus porosity fraction with R2 value for all curves is >0.98.
