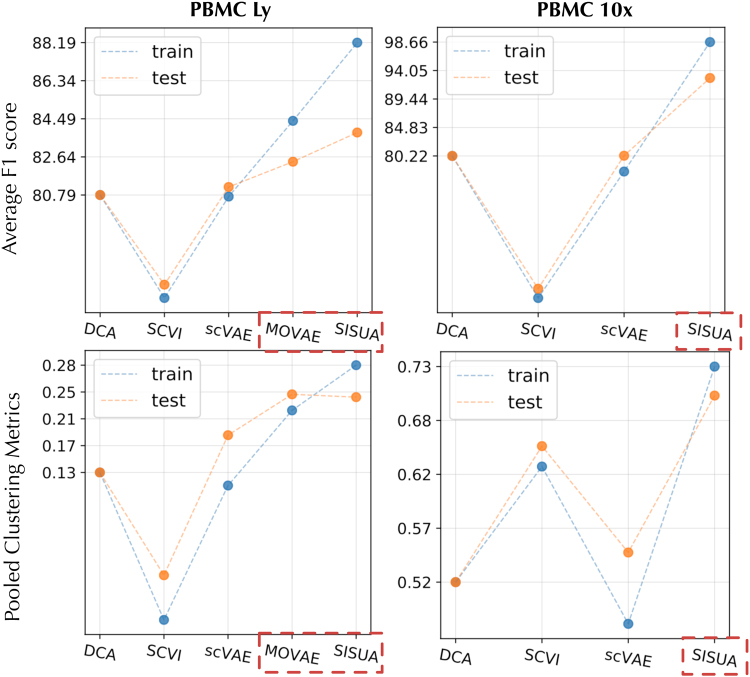
FIG. 10.
Latent spaces are evaluated by two benchmarks. First, the average of F1 scores from a streamline protein/cell-type classifiers; Second, the pooled clustering metric calculated by averaging four measurements: ARI—adjusted rand index, ASW—silhouette score, NMI—normalized mutual information and UCA—unsupervised clustering accuracy. The results are reported for PBMC Ly and PBMC 10x data sets. The train results are shown in blue dots, and the test results in orange dot. Semisupervised models are highlighted by red dashed boxes.

